


Ethereum Price Falls Below $2,400: $106M Binance Long Liquidations After Hot September CPI
Ethereum price slid toward $2,350 on October 15, 2026 after a hotter-than-expected September U.S. inflation report triggered selling across cryptocurrency markets. The roughly 6% drop forced leveraged traders to close substantial bullish positions, producing the largest hourly Ethereum long liquidation event on Binance in six months. Bitcoin price also tumbled below $84,000 on the same CPI shock, underscoring how completely macro data now drives crypto positioning.
- Table of Contents
- Ethereum Price Drops Toward $2,350 After Hot CPI Release
- September CPI Report: 3.7% Annual Inflation Resets Fed Rate Expectations
- Key CPI Figures at a Glance
- Why Energy Drove the Overshoot
- What the CPI Beat Means for Fed Rate Expectations
- $106M in Ethereum Long Liquidations Hits Binance in One Hour
- Ethereum Futures Leverage Amplified the ETH Selloff
- Ethereum Open Interest: Dollar Value Falls While ETH Contracts Hold Steady
- Ethereum ETF Outflows: $129.5M Exits Spot Ether Funds
- Ethereum Price Technical Levels: $2,315 Support and $2,500 Resistance
- What Could Move Ethereum Price Next
- Frequently Asked Questions
- Why did Ethereum price fall after the CPI report?
- How much was liquidated on Binance?
- Did Ethereum ETF outflows contribute to the drop?
- What are the key Ethereum price levels to watch?
- Could Ethereum price recover toward $3,000?
- When is the next Federal Reserve decision?
- Conclusion
The cascade did not come out of nowhere. Traders had built heavy futures exposure before the inflation release, ETH futures volume was running roughly nine times spot volume, and spot Ethereum ETFs had just returned to outflows. When September consumer prices printed 3.7% year over year against a 3.6% consensus, the market repriced the Federal Reserve’s interest-rate path in minutes — and leveraged ETH longs absorbed the worst of it.
Table of Contents
- Ethereum Price Drops Toward $2,350 After Hot CPI Release
- September CPI Report: 3.7% Annual Inflation Resets Fed Rate Expectations
- Key CPI Figures at a Glance
- Why Energy Drove the Overshoot
- What the CPI Beat Means for Fed Rate Expectations
- $106M in Ethereum Long Liquidations Hits Binance in One Hour
- Ethereum Futures Leverage Amplified the ETH Selloff
- Ethereum Open Interest: Dollar Value Falls While ETH Contracts Hold Steady
- Ethereum ETF Outflows: $129.5M Exits Spot Ether Funds
- Ethereum Price Technical Levels: $2,315 Support and $2,500 Resistance
- What Could Move Ethereum Price Next
- Frequently Asked Questions
- Conclusion
Ethereum Price Drops Toward $2,350 After Hot CPI Release
Ethereum price opened the October 15 session near $2,500 and lost ground steadily once the September consumer price index crossed the wires. The decline pushed ETH to roughly $2,350 — a drop of nearly 6% — before trading stabilized. Independent market coverage placed the intraday low near $2,315, with buyers stepping in near the $2,320 area.
The Ethereum price rebound that followed showed demand was not entirely absent. By October 16, ETH had climbed back above $2,420, with analyst Alex Marzell noting that selling pressure had run dry near $2,324 and that subsequent pullbacks kept finding buyers. Whether that represents a genuine reversal or simply a pause before the Federal Reserve’s October 27–28 meeting remains an open question.
Read more: How crypto ETF outflows hit $391 million on October 14 — institutional selling hit both Bitcoin and Ethereum funds in the same session.
September CPI Report: 3.7% Annual Inflation Resets Fed Rate Expectations
The trigger for the entire move was the U.S. Bureau of Labor Statistics report for September, released on October 14. Consumer prices rose 0.6% from August — an acceleration from the 0.4% monthly pace — and pushed annual inflation to 3.7%, up from 3.4% in August and above the 3.6% consensus expectation. Core inflation, which excludes food and energy, rose 0.3% on the month and 2.6% on the year, up from 2.4%.
Key CPI Figures at a Glance
| Category | September vs August | 12 months to September |
|---|---|---|
| All items | +0.6% | 3.7% |
| Excluding food and energy (core) | +0.3% | 2.6% |
| Energy | +5.2% | 20.4% |
| Gasoline | +9.1% | 34.2% |
| Fuel oil | +15.3% | 74.2% |
| Shelter | +0.4% | 3.2% |
| Food | 0.0% | 2.5% |
| Airline fares | +1.2% | 22.4% |
Why Energy Drove the Overshoot
Energy accounted for the majority of the upside surprise. Gasoline jumped 9.1% in a single month and now costs 34.2% more than a year earlier, with the national average pump price near $4.33 a gallon, according to AAA data cited across market coverage. Fuel oil — used to heat homes — rose 15.3% in the month and an extraordinary 74.2% from a year ago. But the report was not purely an energy story: shelter rose 0.4%, airline fares advanced 1.2%, and core inflation accelerated too, which is why the release unsettled markets more than a one-off commodity spike would have.
What the CPI Beat Means for Fed Rate Expectations
The hotter reading forced traders to reassess the Federal Reserve’s path. Before the release, markets assigned low odds to a hike at the October 27–28 meeting; afterward, trackers showed October hike probability climbing to roughly 40% and December odds of at least one increase approaching 90%, per CME FedWatch-based analysis. The pressure compounded a day later when September producer prices came in even hotter — up 1.3% on the month against a 0.6% forecast, the fastest monthly increase since 2022, with the annual rate reaching 6.3%.
The transmission channel into Ethereum price is straightforward: higher-for-longer rate expectations lift the dollar and Treasury yields, draining liquidity appetite from risk assets. Ethereum, with its heavy derivatives footprint, tends to feel that repricing fastest.
$106M in Ethereum Long Liquidations Hits Binance in One Hour
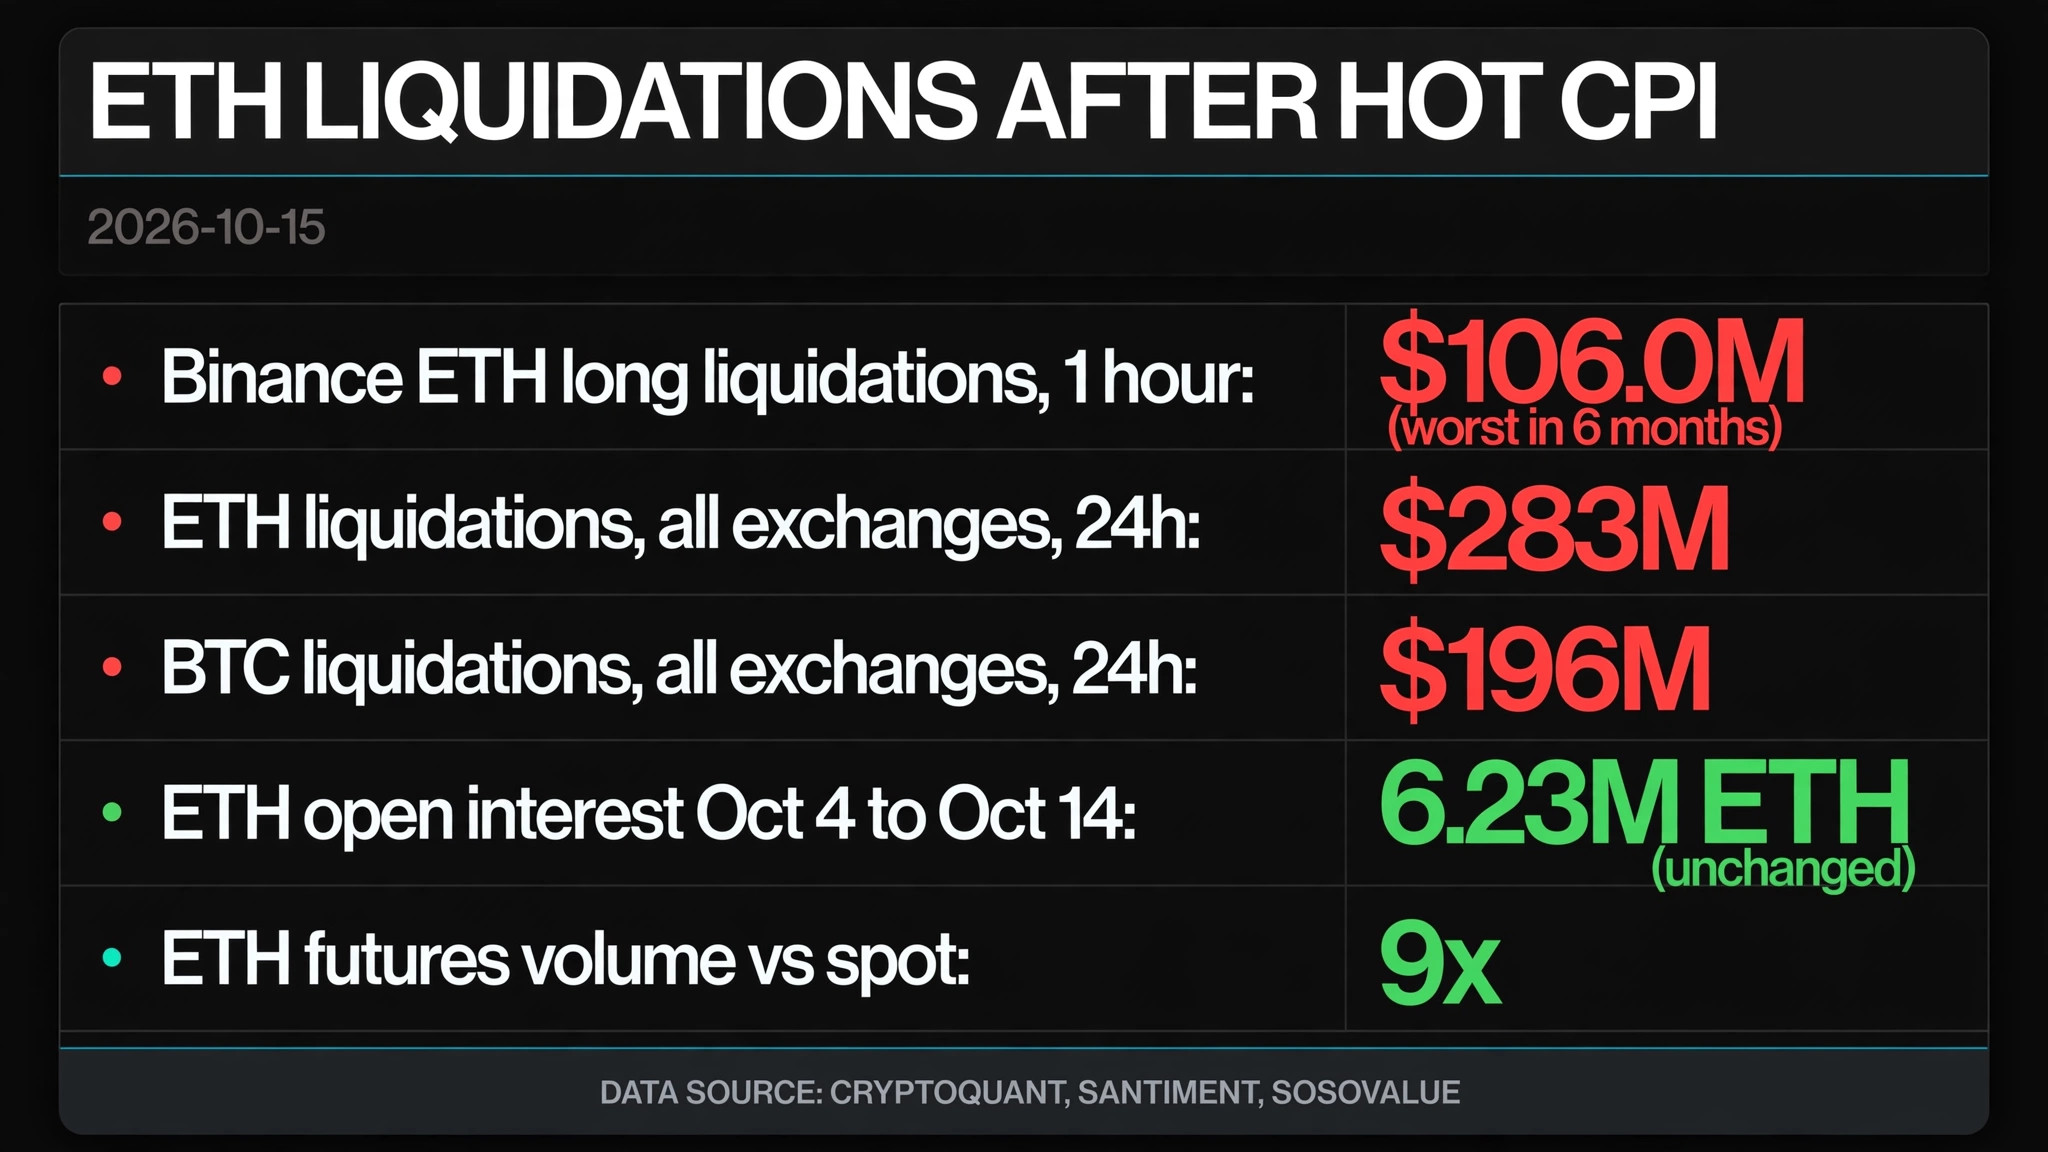
CryptoQuant analyst Darkfost reported that more than $106 million in Ethereum long positions were liquidated on Binance within a single hour following the CPI release — the largest hourly ETH long liquidation event on the exchange in six months. A liquidation occurs when an exchange automatically closes a leveraged position that no longer meets its margin requirements, selling the collateral into a falling market.
That mechanism is what turns a sharp Ethereum price drop into a cascade. When the first wave of positions is forced shut, the resulting selling pushes prices lower still, triggering the next layer of liquidations. The $106 million figure measures the damage concentrated on Binance alone; it does not capture what happened on other venues.
For context, Santiment placed total Ethereum liquidations near $283 million across all exchanges over the same 24-hour period, with Bitcoin recording roughly $196 million. ETH drew the heavier forced selling — a pattern consistent with where leverage was most crowded.
Ethereum Futures Leverage Amplified the ETH Selloff
The scale of the liquidation reflects how leveraged Ethereum price trading had become before the inflation surprise. Darkfost also reported that Ethereum futures trading volume stood at roughly nine times spot volume, meaning the overwhelming share of market activity was concentrated in derivatives rather than actual ETH changing hands.
When nine-tenths of the action sits in leveraged contracts, even a moderate macro shock can generate an outsized price move. Futures traders had maintained substantial exposure into the CPI release — a one-directional bet that inflation would come in soft. The hot print punished that positioning all at once, and the automatic closures did the rest.
This pattern is worth remembering for future data days: the liquidation risk in ETH was visible before the release in the form of elevated derivatives activity. The CPI report was the pin; the leverage was the pin’s target.
Ethereum Open Interest: Dollar Value Falls While ETH Contracts Hold Steady
One of the more counterintuitive data points came from open interest. Santiment reported an 11% decline in Ethereum’s dollar-denominated open interest between October 4 and October 14 — the same period over which ETH’s price fell about 11%.
Measured in ETH rather than dollars, however, open interest was essentially unchanged: 6.23 million coins outstanding on October 4 and 6.23 million again on October 14, fluctuating between 5.97 million and 6.47 million coins through the ten days. The matching declines matter because exchanges value outstanding futures positions in dollars using the underlying asset’s price.
The distinction is important for interpreting what the data means. A falling dollar value alongside flat contract counts suggests the lower figure largely reflected the price decline itself — not traders abandoning positions. In other words, the market was not de-leveraging ahead of the CPI release; it was carrying its exposure straight into it. That reading is consistent with the violence of the Ethereum price liquidation that followed.
Ethereum ETF Outflows: $129.5M Exits Spot Ether Funds
Derivatives were not the only source of Ethereum price pressure. U.S. spot Ethereum ETFs recorded approximately $129.5 million in net outflows on October 14, according to Farside data cited in market coverage. BlackRock’s iShares Ethereum Trust accounted for about $110 million of that — roughly 85% of the category’s withdrawals.
The outflows followed a modest $24.8 million net inflow on October 13, and flow trackers noted that some individual October 14 fund readings were still unavailable when the provisional totals were first published — so the final figure may be revised. Even so, the pattern fits a broader picture of institutional caution: Ethereum funds have now lost well over half a billion dollars in October alone, with net assets shrinking to $15.20 billion from $17.71 billion on October 1.
Ethereum Price Technical Levels: $2,315 Support and $2,500 Resistance
Technically, Ethereum price is working through a well-defined structure. The October 15 low near $2,315 is the line to watch on the downside, with a secondary cushion at $2,400 — the level buyers defended on the bounce back above $2,420. A daily close below $2,315 would open the way toward $2,270 and then $2,140, according to widely cited technical analysis. Above, the 50-day exponential moving average near $2,493 now acts as overhead resistance, and $2,500 remains the level a recovery must reclaim. Clearing $2,578–$2,600 — the neckline of a possible double-bottom formation — would improve the structure materially, while a sustained break above $2,800 could reopen the path toward $3,000.
Momentum indicators reflect the damage: the daily RSI sat near 34 after the drop, per market coverage — weak, though an oversold reading alone has never guaranteed a bounce. The table below frames the possibilities honestly, as scenarios rather than forecasts.
| Scenario | What would need to happen | Likely ETH price implication |
|---|---|---|
| Bull case | Fed signals patience on Oct 27–28; ETF outflows stabilize; ETH closes above $2,500 on strong volume | Test of $2,578–$2,600, then $2,800 |
| Base case | Flows stay mixed; macro uncertainty keeps buyers cautious into the Fed meeting | Range trade between $2,315 and $2,500 |
| Bear case | Hot data continues; ETF redemptions deepen; daily close below $2,315 | Slide toward $2,270, then $2,140 |
What Could Move Ethereum Price Next
Several near-term catalysts will decide whether Ethereum price stabilizes or extends its decline. First, the Federal Reserve’s October 27–28 meeting now carries genuine two-way risk: a patient tone could unwind the hawkish repricing, while fresh tightening signals would deepen it. Second, the daily ETF flow prints — persistent redemptions would confirm institutional caution, while a multi-session inflow streak would suggest the selling is spent.
Third, watch the 10-year Treasury yield and the dollar index, since both rose on the hot data and both pressure ETH. Fourth, the $2,315–$2,500 range itself: a decisive break of either boundary, especially on heavy volume, would likely set the next directional leg.
A simple monitoring checklist for the coming sessions:
- Federal Reserve communications ahead of the October 27–28 decision
- Daily spot Ethereum ETF net flows (provisional prints arrive after the close)
- 10-year Treasury yield and dollar index direction
- Whether $2,315 holds on any retest, and whether $2,500 is reclaimed
- Open interest in ETH terms — a genuine decline would signal real de-leveraging
Readers unfamiliar with the underlying asset can start with a primer on the Ethereum blockchain, the network behind ETH and the spot Ethereum ETFs discussed above.
Not financial advice: this article is for informational purposes only and does not constitute financial or investment advice. Cryptocurrency markets are highly volatile, leveraged trading carries the risk of rapid and total loss, ETF flow data is revised as final fund figures arrive, and macroeconomic conditions can change quickly. Always do your own research and consult a qualified financial adviser before making investment decisions.
Frequently Asked Questions
Why did Ethereum price fall after the CPI report?
September CPI printed 3.7% year over year against a 3.6% consensus, with core inflation also accelerating to 2.6%. The hotter reading raised the odds of further Federal Reserve tightening, lifting the dollar and Treasury yields — headwinds for risk assets. Ethereum price’s heavy derivatives positioning turned the repricing into a liquidation cascade, pushing ETH from roughly $2,500 toward $2,350.
How much was liquidated on Binance?
CryptoQuant analyst Darkfost reported more than $106 million in Ethereum long positions liquidated on Binance within one hour — the largest hourly ETH long liquidation event on the exchange in six months. Across all exchanges, Santiment placed 24-hour Ethereum liquidations near $283 million.
Did Ethereum ETF outflows contribute to the drop?
Spot Ethereum ETFs recorded approximately $129.5 million in net outflows on October 14, with BlackRock’s fund accounting for about $110 million. The provisional nature of some fund readings means the figure may be revised, but the pattern of institutional outflows added selling pressure alongside the derivatives flush.
What are the key Ethereum price levels to watch?
Ethereum price support sits at $2,400 and the October 15 low near $2,315; a daily close below $2,315 would open the way to $2,270 and then $2,140. Resistance starts at the 50-day average near $2,493 and the $2,500 psychological level; clearing $2,578–$2,600 would materially improve the technical structure.
Could Ethereum price recover toward $3,000?
A sustained recovery would require several things to align: a patient Federal Reserve at the October 27–28 meeting, stabilizing ETF flows, and a break above $2,800. Analysts have identified $3,000 as a longer-term possibility only if those conditions materialize; nothing in the current data guarantees it.
When is the next Federal Reserve decision?
The next Federal Open Market Committee meeting is scheduled for October 27–28, 2026. Traders had priced roughly 40% odds of a hike at that meeting after the CPI release, with near-90% odds of at least one increase by December, according to CME FedWatch-based analysis.
Conclusion
The Ethereum price slide toward $2,350 was a textbook example of leverage meeting macro: heavy futures positioning collided with a hotter-than-expected inflation report, and $106 million in forced selling on Binance turned a 6% drop into the largest hourly ETH long liquidation in six months. The open interest data suggests traders carried that exposure into the CPI release rather than reducing it — a warning for the next data day.
From here, the honest read is that Ethereum price is range-bound between $2,315 and $2,500 until the macro picture clears. The October 27–28 Fed meeting, the daily ETF flow prints, and the Treasury yield trend will decide which boundary breaks first. Investors should treat each as a data point rather than a verdict — and size leveraged exposure with full awareness that the next inflation surprise could trigger the same cascade in reverse.