


Key Insights
- XRP price is holding above $1.30, keeping its long-term bullish structure intact.
- Ripple’s presence at Davos has strengthened its institutional narrative and market confidence.
- A breakout above $3.30 could trigger the next major upside phase.
- XRP’s structural support and historical patterns suggest the potential for a significant upward move, but short-term volatility remains a risk.
XRP Price Remains Bullish Above Long-Term Support
XRP has been one of the most talked-about altcoins over the past year, not just for its price movement but for its fundamental narrative. While many cryptocurrencies depend on hype cycles and short-term catalysts, XRP’s trajectory is shaped by a combination of technical structure and institutional developments.
- Key Insights
- XRP Price Remains Bullish Above Long-Term Support
- Long-Term Structure: Descending Wedge Breakout and Accumulation
- CryptoPatel’s Bullish Targets: $3.50, $5.00, $8.70, $10.00
- Structural Similarities Between 2017 and 2025: Fractal Pattern Analysis
- Momentum Indicators: Mixed Signals Across Timeframes
- Short-Term Patterns: Volatility and Correction Risk
- Liquidity Flush: Why Pullbacks May Be Necessary
- Institutional Momentum: Ripple at Davos Strengthens the Narrative
- Summary of Key Levels and Scenarios
- FAQ’s
- Conclusion
As of now, XRP price is holding above the long-term breakout level around $1.30, a key structural support zone that has historically served as the foundation for major upward moves. This area has become the anchor point for XRP’s long-term bullish narrative, with buyers defending it during pullbacks and keeping the market in a higher timeframe bullish structure.
The Importance of Holding $1.30
Why is $1.30 so significant? Because it represents the invalidating level of the multi-year breakout structure that began in 2020 and continued through 2024. This breakout was not a sudden move but rather a long accumulation phase that set the stage for a major trend shift.
When a cryptocurrency completes a long accumulation phase, the breakout area becomes a strong support zone. If price remains above this zone, it confirms that the bullish structure is still intact. However, if price falls below it, the bullish thesis becomes questionable and the market may revert to a bearish or neutral trend.
In XRP’s case, the $1.30 level is not just a number; it represents the line between bullish continuation and potential breakdown.
Long-Term Structure: Descending Wedge Breakout and Accumulation
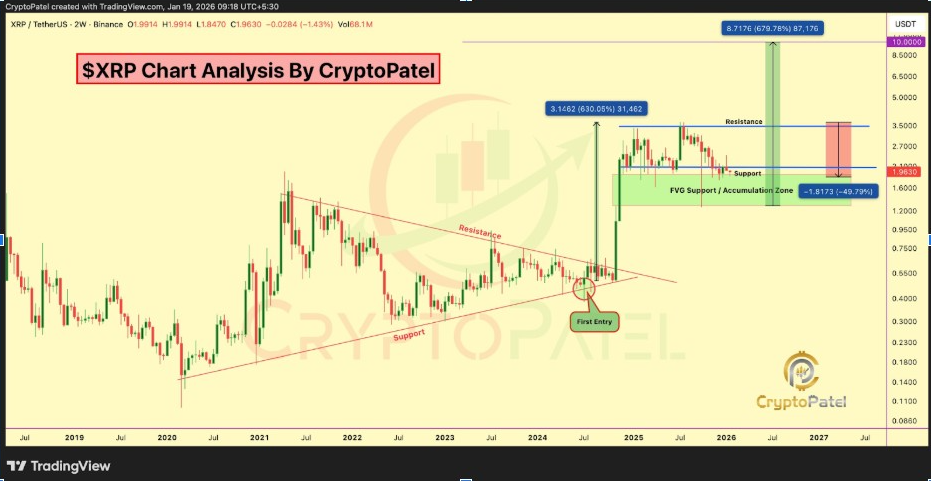
The most critical technical structure supporting XRP’s bullish outlook is the descending wedge breakout on higher timeframes. Analysts have identified this pattern as the basis for the current bullish phase, noting that the market experienced a long accumulation phase between 2020 and 2024.
During this accumulation, XRP formed a base of higher lows and lower highs, compressing into a wedge structure that eventually broke out in a strong upward move. This pattern has historically preceded major expansions, and XRP’s behavior following the breakout has followed that textbook playbook.
What Does the Structure Mean for Future Price Action?
The descending wedge breakout created a new market structure of higher highs and higher lows, which is the hallmark of a bullish trend. Since the breakout, XRP has established a range of consolidation above the breakout zone. This consolidation is a sign of market confidence, as investors hold their positions instead of selling into rallies.
Most importantly, XRP’s long-term structure suggests that the market is still in a bullish continuation phase, not in a distribution or reversal phase.
CryptoPatel’s Bullish Targets: $3.50, $5.00, $8.70, $10.00
Analyst CryptoPatel has mapped potential upside targets that align with historical expansion projections. His targets include:
- $3.50
- $5.00
- $8.70
- $10.00
These levels are not arbitrary. They represent historical price extension zones that correspond with previous expansion phases in XRP’s market history. The key level to watch now is $3.30, which sits directly below the first major resistance zone.
Why $3.30 Is the Key Breakout Level
A confirmed breakout above $3.30 would signify a major shift in market structure. It would mean that XRP has overcome a significant resistance barrier and is ready to enter a new phase of price discovery.
If XRP breaks above $3.30 and sustains above it, the path to $5.00 becomes realistic. From there, $8.70 and $10.00 become the next logical targets, driven by the same momentum and structural continuation.
However, if XRP fails to break $3.30 and faces rejection, the market may rotate sideways or pull back into consolidation. Traders will be watching weekly candle closes to confirm the next direction.
Structural Similarities Between 2017 and 2025: Fractal Pattern Analysis
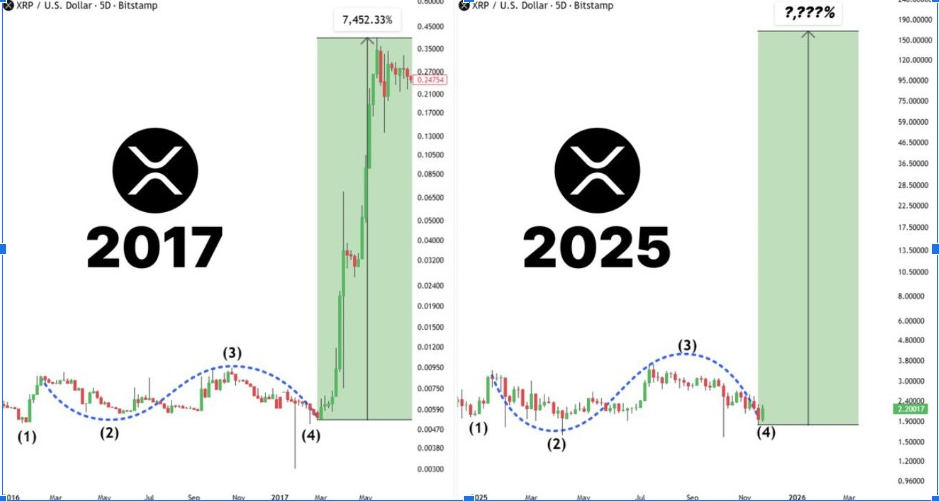
Another important narrative comes from analyst Sacred, who identified a fractal similarity between XRP’s 2017 structure and the current 2025 structure. According to Sacred’s analysis, XRP has followed a four-wave accumulation pattern that resembles the structure seen in 2017.
Why This Matters
In 2017, XRP experienced a massive surge after completing the accumulation pattern. The result was a 7,452% rally, a parabolic expansion that marked one of the most explosive phases in XRP’s history.
Sacred argues that the current structure is behaving similarly. The market has compressed and formed a base, and XRP is now in the final stage of accumulation. This suggests that the next phase could be an explosive expansion if the structure remains intact.
The Fourth Wave Completion
Sacred also noted that XRP recently filled the fourth leg of the accumulation pattern, which historically represents the final stage before a major breakout. If this is accurate, the market is in a transitional phase where volatility increases before a decisive move.
This is a critical point: high volatility does not necessarily mean a bearish outcome. Instead, it often indicates that the market is preparing for a large directional move, which could be upward if the structure remains intact.
Momentum Indicators: Mixed Signals Across Timeframes
While the higher timeframe structure remains bullish, momentum indicators show mixed readings across different timeframes. This is a natural consequence of consolidation, not necessarily a sign of trend failure.
Why Consolidation Creates Mixed Momentum Signals
During consolidation, price moves sideways within a range. Momentum indicators may show cooling pressures on lower timeframes, while higher timeframes still reflect bullish conditions. This divergence is common and reflects the market’s need to reset before continuing the trend.
In XRP’s case, the long-term bullish structure remains intact because buyers continue to defend the key support zones.
Short-Term Patterns: Volatility and Correction Risk
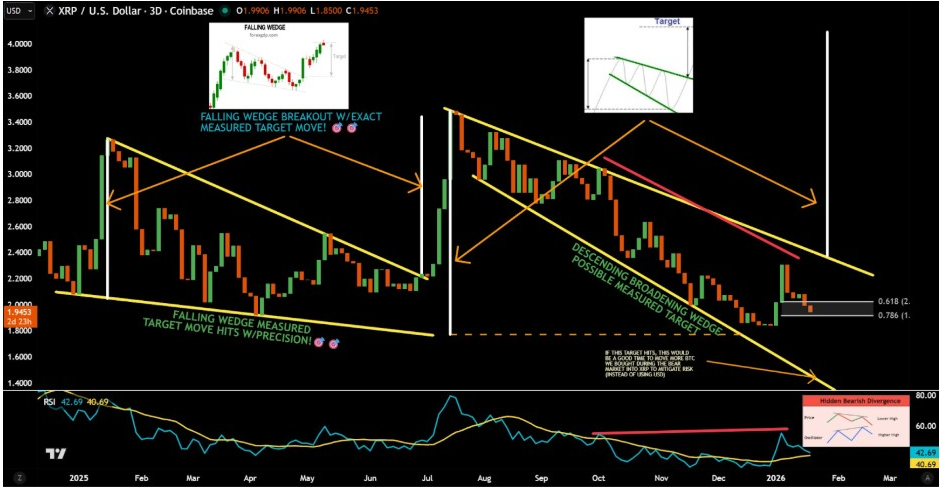
Despite the bullish long-term outlook, short-term charts show corrective structures forming below resistance. Analyst JD highlighted a bearish divergence on the three-day timeframe, which indicates that the market may experience another corrective leg before the next breakout.
What the Bearish Divergence Means
Bearish divergence occurs when price makes higher highs but momentum indicators make lower highs. This is often a warning sign that the trend may be losing strength and that a correction could occur.
JD also pointed out a supply zone overhead, which could trigger a pullback. This supply zone represents a price area where sellers may be waiting to take profits, which increases the risk of short-term downward pressure.
The Descending Broadening Wedge
JD’s analysis also identified a descending broadening wedge on intermediate timeframes. This pattern usually indicates volatility expansion, which means the market may experience larger price swings. XRP is currently trading near the midpoint of this wedge, and the next move could involve a test of lower Fibonacci retracement levels.
Key Retracement Levels to Watch
If XRP pulls back, traders will watch these key levels for potential support:
- 0.618 Fibonacci retracement
- 0.786 Fibonacci retracement
These levels often act as strong support zones during corrections. If XRP finds support at these levels, it may resume the bullish trend and continue the next expansion phase.
Liquidity Flush: Why Pullbacks May Be Necessary
JD also highlighted a concept known as liquidity flush, where stronger rallies follow deeper pullbacks. This is a common pattern in financial markets where weaker hands are eliminated during corrections, and stronger hands accumulate positions near support.
In XRP’s case, a deeper pullback could actually strengthen the bullish case by creating more buying pressure near key support zones. This process can reset overheated indicators and create a more sustainable upward trend.
Institutional Momentum: Ripple at Davos Strengthens the Narrative
While technical analysis is crucial, XRP’s long-term outlook is also driven by fundamental factors, particularly institutional developments. One of the most significant catalysts for XRP is Ripple’s increasing presence at the World Economic Forum in Davos.
Why Davos Matters for XRP
Davos is a global forum where institutional investors, policymakers, and technology leaders converge to discuss the future of finance and technology. Ripple’s CEO, Brad Garlinghouse, is expected to speak on topics such as tokenization, enterprise blockchain adoption, and regulatory alignment.
This institutional exposure is significant for XRP because it strengthens the narrative that Ripple is not just a cryptocurrency project, but a real-world infrastructure provider with institutional adoption potential.
“Davos Rewind III” and the Institutional Narrative
Crypto Squire reignited market excitement with the “DAVOS REWIND III” clip, which revisits Garlinghouse’s Bloomberg interview. In that interview, Garlinghouse stated that crypto is at a regulatory crossroads and emphasized the need to future-proof digital assets.
This narrative supports the idea that XRP is positioned to benefit from regulatory clarity and institutional adoption. Even if market participants have mixed feelings about Ripple’s regulatory path, institutional exposure tends to boost long-term confidence.
Summary of Key Levels and Scenarios
Here is a concise summary of the most important price levels and scenarios for XRP:
Bullish Scenario
- XRP remains above $1.30
- Breakout above $3.30
- Next targets: $3.50, $5.00, $8.70, $10.00
Bearish Scenario
- XRP breaks below $1.30
- Failure to break $3.30
- Price may rotate sideways or retest lower support zones
Short-Term Correction Scenario
- Bearish divergence on 3-day timeframe
- Potential pullback to Fibonacci support levels
- Liquidity flush before next breakout
Read More: Uniswap Surges 26% in a Day: Can UNI Break $10 Again?
FAQ’s
Why is XRP considered bullish right now?
XRP is holding above the long-term breakout support at $1.30, maintaining a multi-year bullish structure. This suggests the long-term uptrend remains intact.
What is the key level XRP must break to continue its bullish trend?
The major resistance level to watch is $3.30. A confirmed breakout above this level could trigger the next significant upward phase.
What happens if XRP falls below $1.30?
A drop below $1.30 would invalidate the bullish structure and could signal a deeper correction or trend reversal.
How does Ripple’s presence at Davos affect XRP?
Ripple’s institutional exposure at Davos strengthens confidence in XRP by highlighting real-world adoption, tokenization use cases, and regulatory progress.
What are the next potential targets for XRP if the breakout holds?
If the breakout above $3.30 holds, analysts expect targets at $3.50, $5.00, $8.70, and $10.00, based on historical expansion projections.
Conclusion
XRP is currently holding a long-term bullish structure, supported by a multi-year accumulation base and a descending wedge breakout. The $1.30 support zone remains crucial, as it defines the line between bullish continuation and potential breakdown.
While short-term volatility and corrective patterns are possible, the overall market structure suggests that XRP is in a continuation phase, with the next major breakout likely to occur if price surpasses the $3.30 resistance zone.
Institutional momentum, fueled by Ripple’s presence at Davos and the growing narrative around tokenization and regulatory clarity, adds further strength to XRP’s long-term bullish outlook.
If XRP maintains its structural integrity and breaks above $3.30, the next major targets could range from $5 to $10, consistent with historical expansion patterns. However, traders should remain cautious and watch for potential corrections and liquidity flushes that could shape the next phase of the trend.