


Key Insights
- Solana price has bounced off the $127–$129 demand zone, which now acts as the key support level for short-term bullish continuation.
- The next resistance range is between $133 and $136, a level that historically has served as a consolidation and breakout point.
- Solana’s decentralized exchange (DEX) volume surged to $4.67 billion, surpassing Ethereum, BSC, and Base in 24-hour on-chain activity.
- The newly launched $SKR token surged over 300%, with trading volume exceeding $235 million, reinforcing bullish sentiment around Solana.
Solana Reclaims Critical Support Amid Rising On-Chain Activity
Solana’s recent price action suggests that the market is attempting to regain control after a significant pullback. The rebound from the $127–$129 range is not merely a technical bounce; it represents a critical reclaiming of demand that many analysts view as foundational to the next directional move.
- Key Insights
- Solana Reclaims Critical Support Amid Rising On-Chain Activity
- The $127–$129 Zone: A Turning Point for Solana
- DEX Volume Surges as Solana Leads On-Chain Activity
- Symmetrical Triangle Pattern Targets $230
- Tightening Structure Signals Bullish Continuation
- $SKR Token Launch Drives New Momentum
- $SKR’s Utility and Impact on Solana
- Whale Behavior Indicates Strong Holding
- What’s Next for Solana Price?
- FAQ’s
- Why is Solana’s $127–$129 zone important?
- What is the next resistance level for SOL?
- Why did Solana DEX volume surge recently?
- What does the $SKR token launch mean for Solana?
- How does the symmetrical triangle pattern affect Solana’s outlook?
- What could invalidate the bullish scenario for SOL?
- Is Solana currently overbought or still in consolidation?
- Conclusion
This zone has attracted attention because it reflects a key area where buyers previously stepped in to defend price during earlier consolidation phases. Reclaiming and holding this range signals that traders are willing to accumulate at current levels rather than capitulate to lower prices.
The broader market has also been supportive of this trend. As risk appetite returns to the cryptocurrency space, Solana has emerged as one of the most active networks in terms of decentralized exchange volume, signaling renewed interest and usage.
The $127–$129 Zone: A Turning Point for Solana
Analyst BitGuru has identified the $127–$129 area as a major short-term demand zone for Solana. This region gained significance after Solana experienced a heavy intraday pullback. A strong defense here is essential for the bullish thesis to remain intact.
If the market successfully holds this zone, the next logical target for bulls becomes the $133–$136 resistance range. This level is significant because it previously acted as a consolidation point during prior bullish cycles. A break above it could signal that Solana is ready to resume a more aggressive upward trajectory.
The current structure of Solana price resembles previous bullish setups. Historically, these setups have followed a pattern of:
- Base formation, where price stabilizes after a pullback
- Breakout spike, indicating renewed demand
- Mid-range consolidation, which absorbs excess volatility
- Further continuation, as buyers re-enter
If Solana is repeating this pattern, the current bounce could be the start of another meaningful upward phase.
However, analysts caution that a breakdown below the $127–$129 support would invalidate the bullish scenario and expose lower support levels near $120. Such a move could trigger a deeper sell-off as traders rush to reduce risk.
DEX Volume Surges as Solana Leads On-Chain Activity
One of the most notable developments supporting Solana’s bullish case is its DEX activity. On January 21, Solana recorded $4.67 billion in decentralized exchange volume, surpassing Ethereum, Binance Smart Chain (BSC), and Base in daily chain activity, according to DeFiLlama data.
This milestone is significant because it indicates that Solana is not only attracting price momentum but also real network usage. Higher DEX volume suggests active trading, liquidity provision, and broader participation across the ecosystem.
Historically, increased on-chain activity often precedes stronger price performance. This is because usage-driven demand typically reflects a more sustainable form of growth than speculative trading alone.
Solana’s DEX dominance highlights a potential shift in network competition. While Ethereum has long been the leader in decentralized finance and trading activity, Solana’s performance signals that alternative chains are increasingly capturing market share.
Symmetrical Triangle Pattern Targets $230
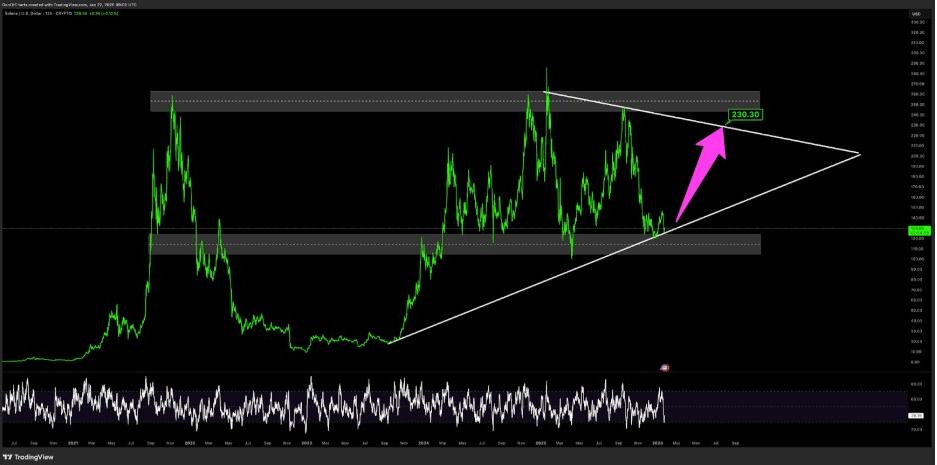
Technical analysis further supports a bullish case for Solana. A long-term symmetrical triangle pattern has formed, suggesting that a breakout could drive price toward $230. This target aligns with historical resistance levels and represents a major psychological milestone for investors.
Symmetrical triangles are typically considered continuation patterns, meaning that they often resolve in the direction of the prevailing trend. In Solana’s case, the long-term trend has been bullish, so a breakout to the upside is the more probable scenario if price escapes the triangle.
The Relative Strength Index (RSI) also supports this view. RSI readings indicate a healthy consolidation phase without extreme overbought conditions. This suggests that Solana may have room to run higher without encountering immediate exhaustion.
Tightening Structure Signals Bullish Continuation
Multiple analysts have noted that Solana’s price structure is tightening on higher timeframes. As accumulation continues above the current support zone, short-term breakout patterns are beginning to emerge.
The key observation is that Solana is forming higher lows while maintaining support near $127. This behavior often precedes a bullish breakout because it indicates that buyers are increasingly confident at higher price levels.
BitGuru’s chart analysis shows a repeating structure of consolidation followed by impulsive upward moves. This pattern suggests that Solana may be building momentum for the next leg up.
If Solana can reclaim the $133–$136 range and sustain it, the next major bullish target becomes the $230 breakout level. However, until that zone is confirmed, the market remains in a state of accumulation rather than confirmed expansion.
$SKR Token Launch Drives New Momentum
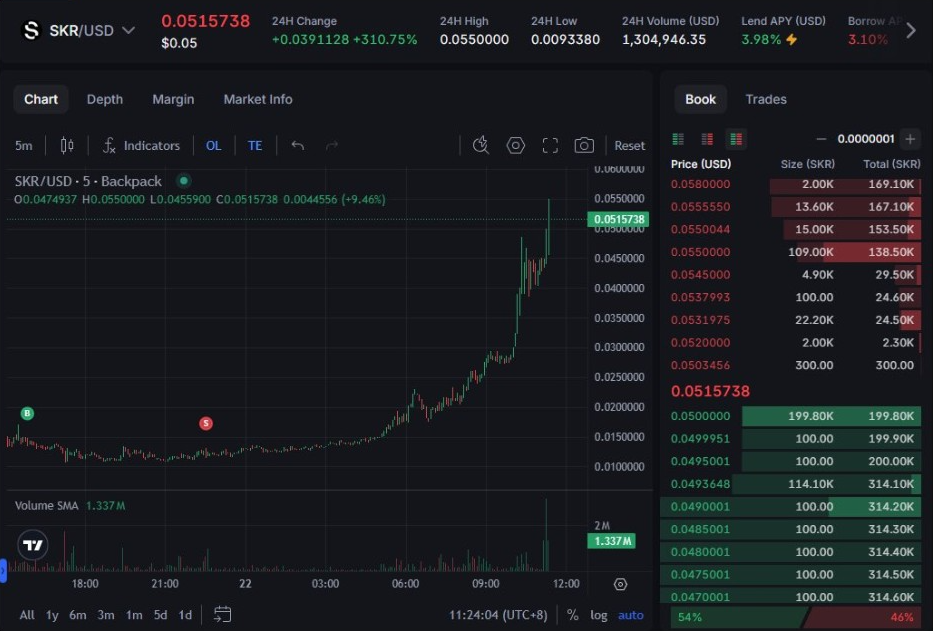
Solana’s bullish narrative has been further strengthened by the launch of Solana Mobile’s native token, $SKR. The token exploded by over 300% within 24 hours, signaling strong demand and ecosystem excitement.
$SKR’s market capitalization increased from an initial fully diluted value (FDV) of around $90 million to over $412 million during the initial trading period. Trading volume exceeded $235 million, primarily on Solana-native DEXs such as Orca and Meteora.
The token distribution included more than 100,000 wallets receiving airdrops, suggesting broad community participation and deep ecosystem integration.
$SKR’s Utility and Impact on Solana
The $SKR token is designed to support the Solana Mobile ecosystem. It provides governance, staking, and dApp incentive functions within the Seeker phone environment. This integration positions Solana Mobile as a potential competitor to traditional app stores, with token-based incentives encouraging app development and user adoption.
Analysts have described $SKR as an “anti-meme” token due to its structured launch and real utility. Unlike meme-based assets that rely on hype, $SKR is tied to an actual product ecosystem and clear use cases.
The token’s launch has boosted bullish sentiment around Solana because it demonstrates real-world application and ecosystem growth, rather than speculative trading alone.
Whale Behavior Indicates Strong Holding
On-chain data from Solscan and Birdeye shows that 90% of whale wallets are holding their SKR allocations, suggesting limited selling pressure. The largest wallet holds over $42 million worth of SKR, yet there is minimal evidence of liquidation or distribution.
This behavior supports the view that $SKR is being treated as a long-term asset rather than a quick-profit speculation. The combination of strong holding behavior and high initial demand has reinforced positive sentiment across the Solana ecosystem.
What’s Next for Solana Price?
Solana’s near-term outlook depends on a few key factors:
- Holding the $127–$129 demand zone
If Solana can maintain support here, the bullish thesis remains intact. - Reclaiming $133–$136 resistance
This zone is the next major test. A successful breakout could open the path to higher targets. - Breakout from the symmetrical triangle
A confirmed breakout would validate the long-term bullish pattern and target $230. - Sustained on-chain activity and DEX volume
Continued network usage would reinforce the fundamental narrative behind price growth. - Market sentiment and broader crypto conditions
Solana’s momentum will also depend on overall risk appetite and market trends.
Read More: Ethereum Price Stabilizes Near $3,000 Amid Liquidations and ETF Outflows
FAQ’s
Why is Solana’s $127–$129 zone important?
The $127–$129 area is a major demand zone where buyers have previously stepped in to defend price. A successful defense here suggests strong accumulation and increases the likelihood of a bullish continuation toward higher resistance levels.
What is the next resistance level for SOL?
The next major resistance range is between $133 and $136. This area has historically acted as a consolidation zone and breakout point, making it a key level for confirming bullish momentum.
Why did Solana DEX volume surge recently?
Solana recorded $4.67 billion in DEX volume, surpassing Ethereum, BSC, and Base. This surge indicates increased trading activity and on-chain usage, which often precedes stronger price performance.
What does the $SKR token launch mean for Solana?
$SKR’s launch has added momentum to Solana’s ecosystem. The token surged over 300%, signaling strong demand and reinforcing bullish sentiment for SOL. It also shows growing adoption through Solana Mobile’s product ecosystem.
How does the symmetrical triangle pattern affect Solana’s outlook?
Solana is trading within a long-term symmetrical triangle. A breakout from this structure could target the $230 region, aligning with historical resistance and representing a major bullish milestone.
What could invalidate the bullish scenario for SOL?
A breakdown below the $127–$129 demand zone would weaken the bullish case and could lead to further downside toward the $120 level, as it would signal a loss of buyer support.
Is Solana currently overbought or still in consolidation?
The RSI indicates healthy consolidation and is not showing overbought conditions. This suggests that Solana has room to move higher if bullish momentum continues, without immediate risk of exhaustion.
Conclusion
Solana’s recent price action and ecosystem activity suggest a strengthening bullish case. The rebound from the $127–$129 demand zone, combined with record DEX volume and the explosive $SKR token launch, indicates renewed interest and momentum.
However, confirmation remains essential. Solana must reclaim the $133–$136 resistance zone and maintain support above $127 to validate the next leg of the rally. The long-term symmetrical triangle breakout target of $230 remains a compelling scenario, but it requires decisive price action and continued ecosystem growth.