

Dogecoin (DOGE), the meme-inspired cryptocurrency that has repeatedly surprised markets with its resilience, is once again trading at a technically important juncture. After weeks of consolidation and volatility, DOGE price action is showing early signs of structural stabilization. Analysts and traders are closely watching whether this consolidation phase will evolve into a bullish reversal or break down into another corrective leg.
- Market Context: Dogecoin Trading at a Decision Point
- Key Insights Driving the Current Dogecoin Outlook
- Dogecoin Price Forms a Double Bottom on Lower Timeframes
- Volume Behavior Signals Shifting Market Dynamics
- Candlestick Compression and Volatility Contraction
- Support Levels Define Near-Term Risk Zones
- Fibonacci Retracement Levels as Reaction Zones
- Higher Timeframe Resistance Shapes the Bigger Picture
- The $0.138 Region as a Pivot Zone
- Long-Term Targets Highlight Potential Upside Scenarios
- Weekly Momentum Indicators Show Early Stabilization
- Current Price Action and Market Sentiment
- What Could Trigger the Next Major Move?
- Conclusion
At present, Dogecoin price is hovering near key support zones, with buyers actively defending critical levels. Multiple technical indicators, chart patterns, and historical price behaviors are converging, suggesting that DOGE may be preparing for a significant directional move. However, confirmation remains elusive, and the market is cautiously awaiting clarity.
This analysis explores the current Dogecoin price structure across multiple timeframes, examines the emerging double bottom pattern, identifies crucial support and resistance zones, and discusses potential upside and downside scenarios based on technical evidence.
Market Context: Dogecoin Trading at a Decision Point
Dogecoin’s recent price movement reflects broader uncertainty in the cryptocurrency market. While Bitcoin and major altcoins have experienced fluctuating momentum, DOGE has remained range-bound, oscillating between clearly defined support and resistance levels.
Currently, Dogecoin price is trading near the $0.136–$0.138 region, an area that has repeatedly attracted buyers. This zone has become a battleground where bulls attempt to establish higher lows, while sellers continue to defend overhead resistance near $0.148–$0.150.
Several analysts believe this prolonged consolidation is not random. Instead, it may represent a base-building process following extended downside pressure earlier in the cycle. Historically, Dogecoin has often spent long periods consolidating before making sudden, high-volatility moves once a breakout level is breached.
Key Insights Driving the Current Dogecoin Outlook
Several technical observations are shaping the near-term narrative around Dogecoin price action:
- Dogecoin has successfully held the $0.136 support zone, forming a potential double bottom structure on lower timeframes.
- A strong demand zone near $0.1232 remains critical for maintaining short-term trend stability.
- Repeated tests of resistance near $0.150 could weaken selling pressure and trigger directional expansion.
- Volume behavior suggests sellers may be losing control, though confirmation is still required.
- Higher timeframe resistance zones remain intact, indicating that DOGE must overcome significant overhead supply before a sustained rally can occur.
Together, these factors paint a picture of a market coiling for a potential breakout, but still constrained by long-standing resistance levels.
Dogecoin Price Forms a Double Bottom on Lower Timeframes
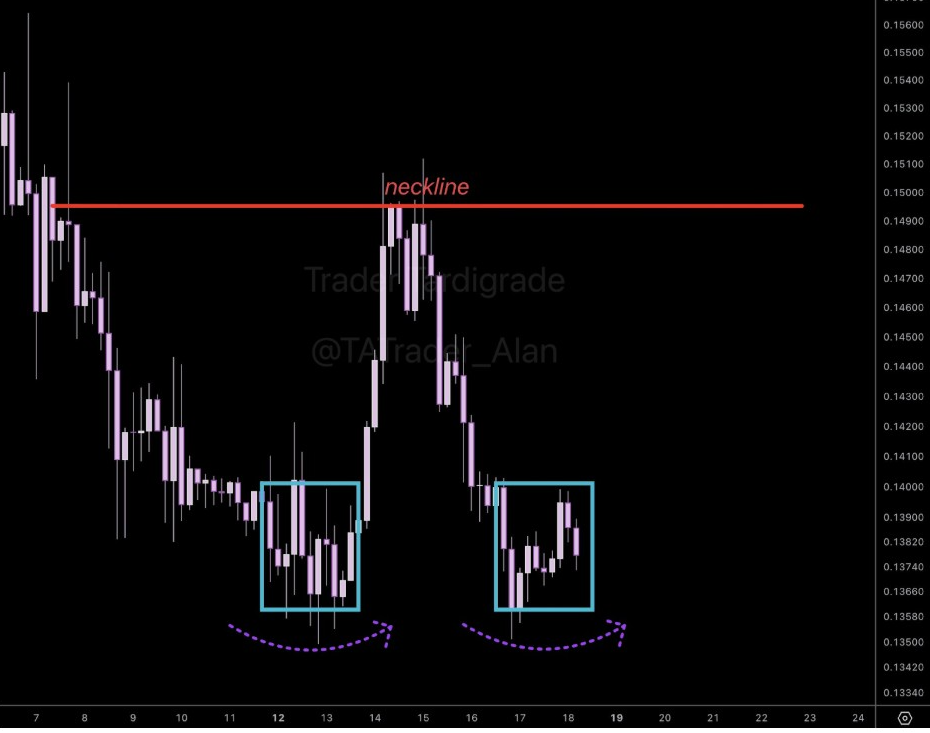
One of the most notable technical developments in recent sessions is the formation of a double bottom pattern on the four-hour chart. This pattern, highlighted by analyst Trader Tardigrade, is widely regarded as a classic bullish reversal structure when confirmed.
Structure of the Double Bottom
The double bottom formed with two nearly identical lows in the $0.136 to $0.138 region. During both declines, sellers pushed price lower but failed to generate sustained downside momentum. Instead, buyers stepped in aggressively, preventing a deeper breakdown and stabilizing price.
The resulting price action created a rounded base rather than a sharp V-shaped reversal. This type of structure often reflects gradual accumulation rather than speculative spikes, which can be a healthier foundation for future price appreciation.
Importance of the Neckline
The neckline of the double bottom pattern is located between $0.148 and $0.150. This zone has repeatedly acted as resistance, rejecting price advances and sending DOGE back toward support.
For the double bottom to be fully confirmed, Dogecoin price must achieve a sustained close above this neckline, ideally accompanied by increased trading volume. Without this confirmation, the pattern remains incomplete and vulnerable to failure.
Volume Behavior Signals Shifting Market Dynamics
Volume analysis plays a critical role in validating chart patterns. In Dogecoin’s case, volume behavior during the formation of the second bottom offers important clues.
During the second test of the $0.136 support zone, selling volume was notably lower than during the first decline. This reduction in selling pressure often indicates seller exhaustion, as fewer market participants are willing to offload their holdings at depressed prices.
At the same time, buy-side activity has been more visible around support zones. While not explosive, this steady accumulation suggests that some investors view current prices as attractive relative to risk.
This type of volume compression frequently precedes a breakout, as price volatility contracts before expanding sharply in one direction.
Candlestick Compression and Volatility Contraction
Short-term candlestick patterns also support the idea that Dogecoin is approaching a decisive move. On lower timeframes, price candles have become increasingly narrow, reflecting a period of consolidation and indecision.
Such compression often occurs when market participants are waiting for confirmation before committing significant capital. Once a key level is breached—either support or resistance—this pent-up energy can result in rapid price movement.
Traders are now watching closely for a strong directional candle near the $0.148–$0.150 region, which could signal the beginning of a breakout or rejection.
Support Levels Define Near-Term Risk Zones
While bullish patterns are developing, Dogecoin price remains vulnerable if key support levels fail. Understanding these downside risk zones is essential for assessing the broader outlook.
The $0.1232 Demand Zone
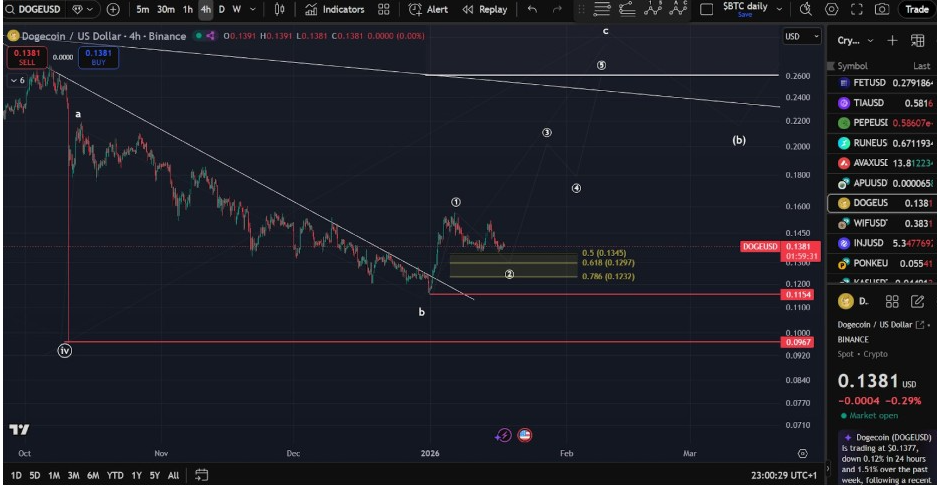
Analyst Man of Bitcoin has identified $0.1232 as a critical support level. This zone has historically acted as a strong demand area, where buyers consistently step in to absorb selling pressure.
As long as Dogecoin price remains above $0.1232, the current recovery structure remains intact. A decisive break below this level would invalidate many bullish setups and signal renewed seller dominance.
Deeper Support at $0.1154
Below $0.1232 lies another important support zone near $0.1154. A breakdown to this level would suggest a continuation of the broader downtrend and expose DOGE to further downside risk.
From a risk management perspective, these levels define the boundary between consolidation and trend continuation to the downside.
Fibonacci Retracement Levels as Reaction Zones
Fibonacci retracement levels are also playing a role in Dogecoin’s current consolidation. Key retracement zones have been identified around $0.1297 and $0.1345.
These levels are acting as intermediate reaction points where price frequently pauses or reverses. Consolidation around these areas reflects market indecision, as buyers and sellers test each other’s strength.
Maintaining higher lows above these Fibonacci levels would strengthen the bullish case, while failure to hold them could invite renewed selling pressure.
Higher Timeframe Resistance Shapes the Bigger Picture
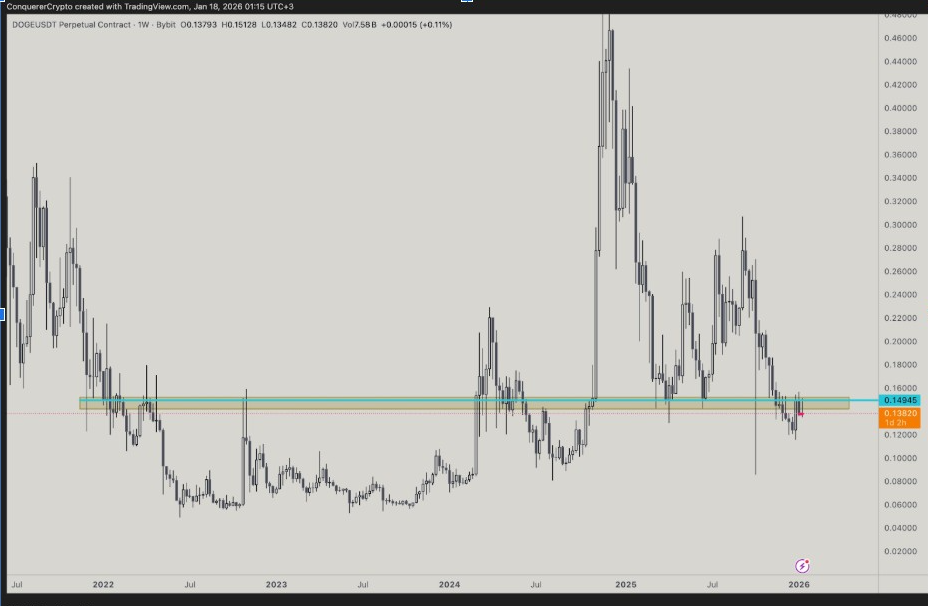
Zooming out to higher timeframes reveals a broader structural challenge for Dogecoin. Weekly charts shared by ConquererCrypto highlight a long-standing horizontal resistance band near $0.149–$0.150.
Historical Rejections at $0.150
Dogecoin has repeatedly failed to sustain price action above this zone. Each attempt to break through has been met with selling pressure, resulting in pullbacks toward lower consolidation areas.
This repeated rejection indicates strong overhead supply, as many holders appear willing to sell when price approaches this level.
Resistance Weakening Through Repeated Tests
However, technical theory suggests that resistance can weaken over time if tested frequently. Each test absorbs some of the available sell orders, potentially making it easier for price to break through on subsequent attempts.
Dogecoin is once again trading close to this resistance zone. A confirmed breakout on the weekly timeframe would represent a significant structural shift and could open the door to a broader trend reversal.
The $0.138 Region as a Pivot Zone
On higher timeframes, the $0.138 region has emerged as a key pivot area. This level currently acts as both support and resistance, depending on short-term price behavior.
Holding above this pivot zone suggests bullish continuation attempts, while sustained trading below it could shift momentum back in favor of sellers.
The ability of DOGE to maintain this level in the coming sessions will likely influence short-term sentiment.
Long-Term Targets Highlight Potential Upside Scenarios
Beyond immediate resistance, some analysts are examining long-term charts to assess Dogecoin’s potential upside if a trend reversal is confirmed.
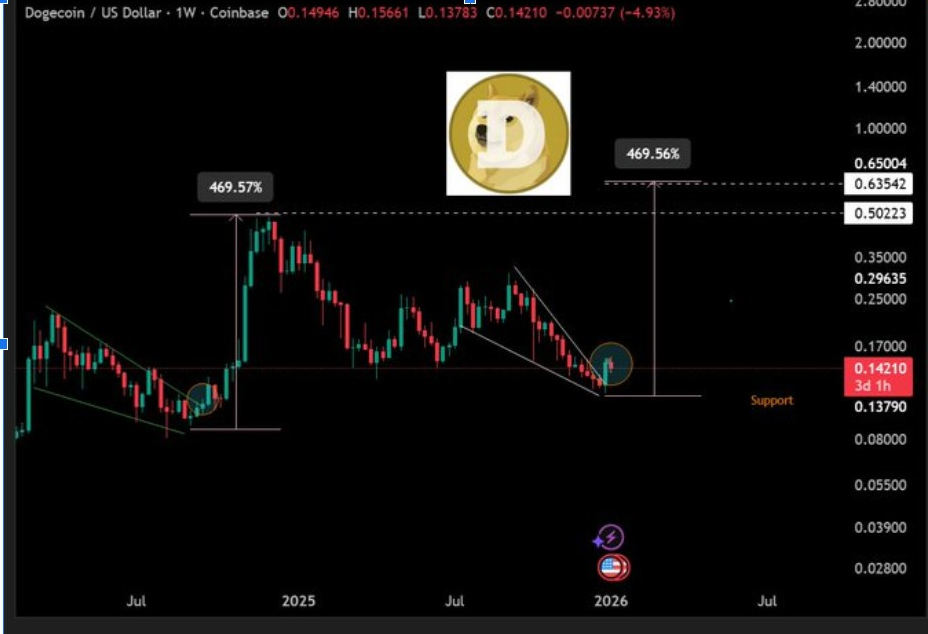
Historical Resistance Between $0.50 and $0.65
A weekly chart shared by Hailey LUNC highlights long-term resistance levels between $0.50 and $0.65. These zones align with previous cycle highs and represent major milestones for any future bull market.
At present, Dogecoin price remains far below these levels. However, historical price behavior suggests that once DOGE enters a sustained uptrend, moves can be rapid and expansive.
Conditions Required for Long-Term Upside
It is important to note that these long-term targets are speculative and contingent on multiple confirmations, including:
- A sustained breakout above $0.150
- Higher highs and higher lows on weekly timeframes
- Increasing volume and broader market strength
- Supportive macro and crypto market conditions
Without these factors, long-term upside projections remain theoretical rather than actionable.
Weekly Momentum Indicators Show Early Stabilization
Momentum indicators on the weekly timeframe provide additional insight into Dogecoin’s condition. After a prolonged period of decline, these indicators are beginning to flatten, suggesting that downside momentum may be weakening.
This stabilization phase often precedes extended consolidation periods rather than immediate rallies. During such phases, price may continue to move sideways as the market absorbs prior losses.
For traders, this environment emphasizes patience and confirmation rather than aggressive positioning.
Current Price Action and Market Sentiment
At the time of writing, Dogecoin price is trading near $0.138, with continued consolidation evident across multiple timeframes. Market sentiment remains cautious but attentive, as traders wait for a decisive signal.
Key levels to watch include:
- Resistance: $0.148–$0.150
- Immediate Support: $0.136–$0.138
- Critical Support: $0.1232
- Deeper Downside Risk: $0.1154
A breakout above resistance, confirmed by volume expansion and sustained closes, would strengthen the bullish narrative. Conversely, a breakdown below critical support would shift focus back to downside risk management.
What Could Trigger the Next Major Move?
Several catalysts could influence Dogecoin’s next major price move:
- Technical Breakout: A confirmed break above $0.150 could trigger algorithmic buying and renewed retail interest.
- Volume Expansion: Increased participation would validate any directional move.
- Broader Market Strength: Bitcoin and overall market sentiment often influence DOGE performance.
- Speculative Momentum: Dogecoin has historically reacted strongly to sentiment-driven rallies once technical levels are cleared.
Read More: XRP Price Outlook: ETF Milestone Sparks $3 Breakout Optimism
Conclusion
Dogecoin price is currently positioned at a critical technical crossroads. The formation of a double bottom, strong defense of key support levels, and repeated tests of resistance suggest that a meaningful move may be approaching.
However, resistance near $0.150 remains formidable, and confirmation is essential before assuming a sustained rally. Traders and investors should closely monitor volume, price structure, and higher timeframe behavior to assess the validity of any breakout or breakdown.
In the short term, Dogecoin’s fate hinges on whether buyers can maintain control above $0.136 and ultimately push price through the $0.150 resistance zone. Until then, consolidation and cautious optimism define the market landscape.