
Key Insights
- Polygon (POL) price is trading inside a falling wedge pattern on the hourly chart, and a confirmed breakout could push the price toward $0.20.
- Whale address 0x761 bought 2.5 million POL from Kraken, increasing total holdings to approximately 3 million POL.
- Polygon PoS recently recorded $83.3 million in net inflows over seven days, helping it enter the top 10 Layer-2 tokens by market capitalization.
- Polygon is currently ranked second among Ethereum Layer-2 networks by market cap, behind Mantle (MNT).
- Overall network activity, institutional interest, and market structure suggest that POL may be preparing for an upward move.
Introduction: Why Polygon Remains Central to the Layer-2 Narrative
Polygon has long been one of the most important Layer-2 ecosystems in the Ethereum scaling landscape. While newer competitors have emerged, Polygon’s early leadership position and strong developer ecosystem continue to support its relevance.
- Key Insights
- Introduction: Why Polygon Remains Central to the Layer-2 Narrative
- Polygon’s Current Market Position
- Signal 1: Falling Wedge Pattern Suggests Bullish Breakout Potential
- Understanding the Falling Wedge Pattern
- Polygon’s Falling Wedge on the Hourly Chart
- Why the $0.150 Level Is Critical
- Target Levels After Breakout
- What Happens If the Breakout Fails?
- Signal 2: Whale Accumulation Intensifies, Suggesting Stronger Demand
- Whale 0x761 Accumulates POL
- Whale Behavior Signals Confidence
- Mixed Signals from Other Whale Tiers
- Why Whale Accumulation Matters
- Signal 3: Strong Net Inflows Into Polygon PoS Suggest Growing Investor Confidence
- Polygon PoS Leads Net Inflows
- Why Net Inflows Matter
- The Importance of Network Activity
- Potential Risks to Net Inflows
- How the Three Signals Combine to Support a Bullish Thesis
- Potential Scenarios for POL Price
- Trading Strategies to Consider
- Market Sentiment and Investor Psychology
- FAQ’s
- What is the main bullish signal for Polygon (POL) right now?
- Why is the $0.150 level important for POL price?
- What does whale activity indicate for Polygon’s future price?
- How much POL did the whale buy, and why does it matter?
- What role do net inflows into Polygon PoS play?
- Could Polygon still fail to break out despite these signals?
- What are the main risks to the bullish outlook for POL?
- Conclusion
The market has been volatile, and POL’s price action has mirrored the broader risk-on and risk-off cycles. However, recent on-chain data and price structure suggest that Polygon may be preparing for a breakout. Three primary signals support this thesis: a technical bullish pattern, significant whale accumulation, and strong net inflows into Polygon PoS.
Together, these factors point to a potential shift in momentum and investor sentiment. While the market is never guaranteed, the combination of these signals increases the probability that Polygon could experience an upward move toward the $0.20 level.
Polygon’s Current Market Position
A Competitive Layer-2 Landscape
The Layer-2 ecosystem has become crowded. New networks like Base, Hyperliquid, and Mantle have attracted attention and capital, forcing Polygon to compete for developer attention, TVL (Total Value Locked), and user activity.
Despite this competition, Polygon has maintained its standing due to several advantages:
- Established ecosystem and strong developer base
- Diverse scaling solutions (PoS, zkEVM, etc.)
- Strong partnerships and real-world adoption
- Broad liquidity and exchange support
Polygon’s current market cap position—second to Mantle among Layer-2 networks—signals that the market still views it as a major player.
Signal 1: Falling Wedge Pattern Suggests Bullish Breakout Potential
Understanding the Falling Wedge Pattern
A falling wedge is a technical chart pattern that typically forms during a downtrend or consolidation phase. It is characterized by:
- Lower highs and lower lows
- A narrowing price range
- A bullish bias because the lower boundary slope is less steep than the upper boundary
- Breakouts often lead to trend reversals
In many cases, a falling wedge indicates that bearish momentum is weakening and buyers are preparing to take control.
Polygon’s Falling Wedge on the Hourly Chart
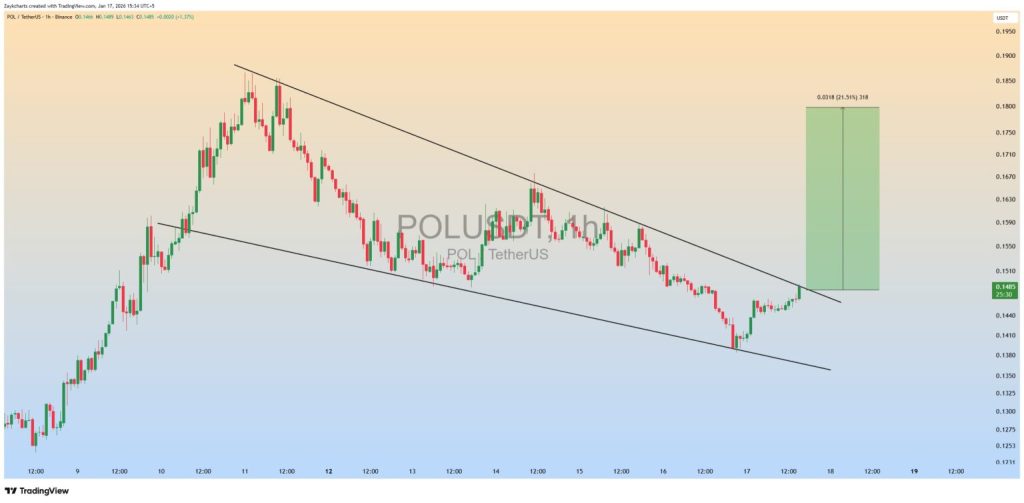
On the hourly chart, Polygon has been trading within a clear falling wedge structure. The price has been consolidating between two downward-sloping trendlines, with the upper resistance line near $0.150 and the lower support near $0.138–$0.140.
The price recently bounced from the lower boundary, indicating that buyers were defending the support zone. This bounce set the stage for a potential breakout attempt.
Why the $0.150 Level Is Critical
The $0.150 resistance level is a key decision point for Polygon. It represents the upper boundary of the wedge and a major psychological level for traders.
If POL breaks above $0.150 and closes above this level, it would confirm the wedge breakout and open the door to higher price targets.
Target Levels After Breakout

Based on the pattern and historical consolidation levels, the following targets could be expected:
- First target: $0.165
- Second target: $0.180
- Long-term target: $0.20
Each level represents a prior area of consolidation or resistance, meaning traders and investors are likely to react as price approaches these zones.
What Happens If the Breakout Fails?
A failed breakout could lead to a retest of support. The key downside levels to watch are:
- $0.142 (near-term support)
- $0.138–$0.140 (wedge lower boundary)
A break below $0.138 could increase the probability of further downside and invalidate the bullish thesis. In that case, the market may move into deeper consolidation or bearish territory.
Signal 2: Whale Accumulation Intensifies, Suggesting Stronger Demand
Whale activity often provides valuable insight into market sentiment. Large holders can move markets, and their accumulation is usually interpreted as a sign of confidence.
Whale 0x761 Accumulates POL
A whale address identified as 0x761 purchased 2.501 million POL from Kraken’s hot wallet, worth approximately $361,670. The whale also received 372,296 POL in staking rewards, bringing total holdings to 2.963 million POL, valued at about $438,182 at the time of analysis.
This accumulation is significant for several reasons:
- It indicates long-term positioning rather than short-term trading.
- The whale made multiple staking-related transactions, suggesting a commitment to holding and participating in the network.
- Large accumulation reduces circulating supply and can support price stability.
Whale Behavior Signals Confidence
The whale used “Buy Voucher” staking transactions, which implies the whale is not only accumulating but also participating in the network’s staking ecosystem.
This is important because it suggests a belief in the long-term viability of Polygon and the potential for future appreciation.
Mixed Signals from Other Whale Tiers
While the top-tier whales (over 1 billion POL holdings) have increased their holdings by about 30 million POL since January 1, mid-tier holders (10 million to 1 billion POL) have sold about 44 million POL, likely taking profits.
This mixed behavior suggests a market with both long-term accumulation and profit-taking. While profit-taking can limit near-term gains, the net accumulation from top-tier whales still supports a bullish outlook.
Why Whale Accumulation Matters
Whale accumulation matters because:
- It reduces supply available for trading
- It signals confidence in future price appreciation
- It can act as support during pullbacks
- It often precedes bullish momentum
However, it is also important to recognize that whales can sell at any time. Therefore, monitoring whale behavior over time is essential to validate the bullish thesis.
Signal 3: Strong Net Inflows Into Polygon PoS Suggest Growing Investor Confidence
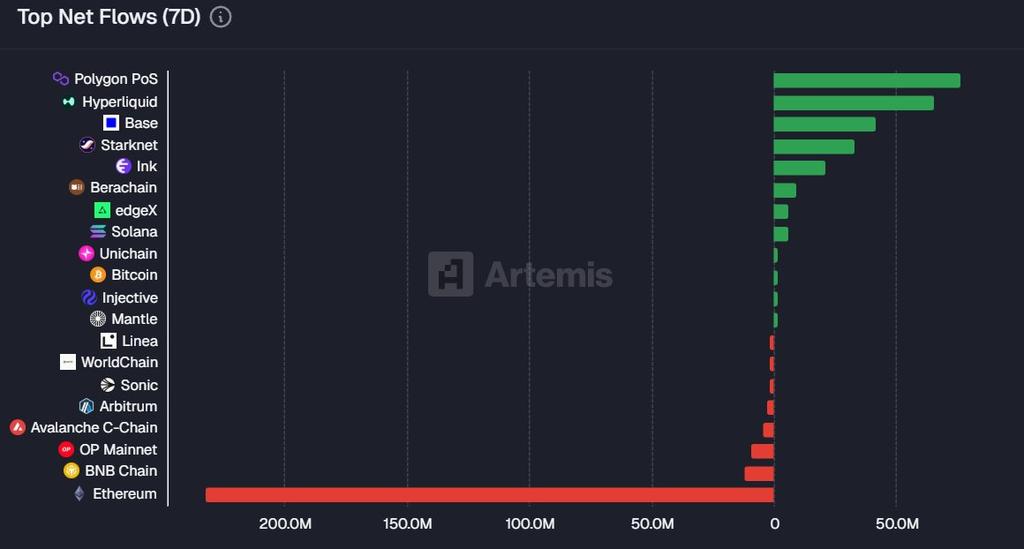
Polygon PoS Leads Net Inflows
Artemis data revealed that Polygon PoS led the weekly net inflows with approximately $75 million, surpassing major rivals such as Hyperliquid and Base.
These inflows indicate that investors are reallocating capital into Polygon, potentially due to improved network fundamentals or rising confidence in Polygon’s long-term trajectory.
Why Net Inflows Matter
Net inflows matter because they represent capital entering the ecosystem. This capital can support price appreciation in several ways:
- Increased liquidity and trading volume
- Higher demand for POL tokens
- Greater network usage and activity
- Enhanced investor confidence
In other words, net inflows are a strong indicator of market demand and investor interest.
The Importance of Network Activity
Network activity is another key factor. As more users transact on Polygon PoS and more dApps gain traction, the network becomes more valuable.
This increased value often translates into higher token demand, which supports price growth.
Potential Risks to Net Inflows
However, net inflows can reverse. Outflows could return if:
- Investors rotate to other Layer-2 ecosystems
- Market sentiment turns bearish
- The broader crypto market experiences a downturn
In such cases, POL price could stagnate or decline.
How the Three Signals Combine to Support a Bullish Thesis
Technical Structure
The falling wedge pattern suggests that bearish momentum is slowing, and a breakout could lead to a trend reversal.
Whale Accumulation
Large whales accumulating POL supports the idea of reduced supply and long-term confidence.
Net Inflows
Strong capital inflows into Polygon PoS indicate that investors are actively allocating funds to the network.
Together, these signals create a compelling case for a potential breakout.
Potential Scenarios for POL Price
Bullish Scenario
- POL breaks above $0.150
- Price retests and holds above $0.150
- Rally toward $0.165 and $0.180
- Potential move toward $0.20
Bearish Scenario
- POL gets rejected at $0.150
- Price drops below $0.142
- Retest of $0.138–$0.140
- Potential further downside if support fails
Neutral Scenario
- POL remains range-bound between $0.138 and $0.150
- Consolidation continues as market awaits clearer catalysts
Trading Strategies to Consider
Breakout Strategy
- Enter long position after confirmed close above $0.150
- Set stop-loss below $0.142
- Take partial profits near $0.165 and $0.180
Range Trading Strategy
- Buy near $0.138–$0.140
- Sell near $0.150
- Use tight stop-loss if price breaks below $0.138
Risk Management
- Use position sizing to manage risk
- Avoid overleveraging in volatile environments
- Monitor whale behavior and inflows for trend confirmation
Market Sentiment and Investor Psychology
Market sentiment has shifted toward cautious optimism. The shift in language among informed investors suggests growing confidence. This is further supported by the capital inflows and whale accumulation.
However, sentiment can change quickly in crypto. Therefore, it is crucial to monitor price action, network activity, and on-chain data to confirm the bullish thesis.
Read More: Vanguard Buys $505M MSTR Stock as Strategy Signals Price Reversal
FAQ’s
What is the main bullish signal for Polygon (POL) right now?
The primary bullish signal is the falling wedge pattern on the hourly chart. A breakout above the wedge’s resistance near $0.150 could trigger a strong upward move toward $0.20.
Why is the $0.150 level important for POL price?
$0.150 is the upper boundary of the falling wedge and a key psychological resistance level. A clean break and daily close above it would confirm the bullish reversal and likely attract more buyers.
What does whale activity indicate for Polygon’s future price?
Whale accumulation, particularly from address 0x761, suggests strong long-term confidence. Large holders accumulating POL can reduce circulating supply and support price appreciation.
How much POL did the whale buy, and why does it matter?
Whale 0x761 bought 2.5 million POL from Kraken and increased holdings to nearly 3 million POL. Such large purchases often signal institutional or long-term investor confidence, which can be bullish for price.
What role do net inflows into Polygon PoS play?
Net inflows indicate capital entering the Polygon ecosystem. With Polygon PoS leading weekly inflows at $83.3M, it shows strong investor demand and confidence in the network, which can support price growth.
Could Polygon still fail to break out despite these signals?
Yes. If POL gets rejected at $0.150 and drops below $0.142, the bullish pattern would be invalidated. The price could then retest support near $0.138–$0.140, increasing downside risk.
What are the main risks to the bullish outlook for POL?
Key risks include:
Rejection at the $0.150 resistance level
Increased selling from mid-tier whales
Outflows from Polygon PoS
Strong competition from other Layer-2 networks
Broader market downturns affecting risk assets
Conclusion
Polygon is currently positioned at a critical decision point. The convergence of technical, on-chain, and capital flow signals suggests that a bullish breakout is possible.
The falling wedge pattern indicates a potential trend reversal, while whale accumulation and strong net inflows show that investors are building positions and increasing confidence in Polygon’s long-term outlook.
However, the $0.150 resistance level is decisive. A clean breakout and close above this level would increase the probability of a move toward $0.20. On the other hand, rejection at $0.150 could push the price back into consolidation or deeper correction.
Ultimately, the current market structure suggests that Polygon is at the beginning of a potentially significant upward move, but confirmation through price action and continued capital inflows is essential.