


Bitcoin ETF Outflows Hit $261M as Crypto ETFs Lose $391M: Will $80K Hold?
US spot crypto ETFs recorded roughly $391 million in combined net withdrawals on October 14, 2026, erasing the previous session’s recovery as institutional investors pulled back from both Bitcoin and Ethereum products. Spot Bitcoin ETFs accounted for $261.46 million of the exits, while spot Ethereum ETFs lost $129.51 million, according to flow data tracked by SoSoValue.
- Bitcoin ETF Outflows on October 14: The Key Numbers
- Ethereum ETF Outflows: ETHA’s $110M Exit Tells a Bigger Story
- How Crypto ETF Redemptions Actually Reach the Spot Market
- What October’s Swinging ETF Flows Reveal About Sentiment
- Bitcoin Price Near $80,000: Support and Resistance Levels
- What Could Turn Crypto ETF Flows Positive Again
- Risks to Watch If Bitcoin Breaks Below $80,000
- Frequently Asked Questions
- How much did crypto ETFs lose on October 14, 2026?
- Which Bitcoin ETF had the largest outflow?
- Why did Bitcoin fall back toward $80,000?
- Can Bitcoin hold $80,000?
- Do ETF outflows always push Bitcoin’s price lower?
- Are Ethereum ETFs performing worse than Bitcoin ETFs?
- Conclusion
The reversal came just one day after the two categories had attracted $200.46 million in combined net inflows — a whipsaw that shows how unsettled institutional positioning has become this month. Bitcoin slid back toward $81,000 in the aftermath, trading near $80,997 and down around 2.4% on the day, putting the psychologically important $80,000 level back in play as the line bulls must defend. To interpret swings like this without overreacting to a single number, our guide on how to read Bitcoin ETF flows correctly explains which signals actually matter beyond the daily headline.
- Bitcoin ETF Outflows on October 14: The Key Numbers
- Ethereum ETF Outflows: ETHA’s $110M Exit Tells a Bigger Story
- How Crypto ETF Redemptions Actually Reach the Spot Market
- What October’s Swinging ETF Flows Reveal About Sentiment
- Bitcoin Price Near $80,000: Support and Resistance Levels
- What Could Turn Crypto ETF Flows Positive Again
- Risks to Watch If Bitcoin Breaks Below $80,000
- Frequently Asked Questions
- Conclusion
Bitcoin ETF Outflows on October 14: The Key Numbers
The October 14 session was not a broad, even retreat across all Bitcoin funds. It was concentrated in two large products, with the rest of the field roughly flat — a pattern that says as much about who was selling as about how much left the category.
| Fund | Net flow on Oct 14 |
|---|---|
| Fidelity FBTC | -$152.7 million |
| BlackRock IBIT | -$110.9 million |
| Bitwise BITB | +$2.2 million |
| Remaining funds combined | Roughly flat |
| Total, US spot Bitcoin ETFs | -$261.4 million |
Source: daily creation/redemption estimates reported by Farside Investors, October 15, 2026.
Two Funds Did Nearly All the Damage
Fidelity’s FBTC led the redemptions with $152.7 million leaving the fund, followed by BlackRock’s IBIT with $110.9 million in withdrawals. Together the two accounted for $263.6 million in outflows — slightly more than the category’s net total, because Bitwise’s BITB pulled in $2.2 million and offset part of the damage.
This concentration matters. FBTC and IBIT are the two largest products in the category, so a modest percentage shift in investor positioning inside them produces an outsized dollar number. The figures suggest that the selling was driven by a limited number of large allocators adjusting exposure, rather than a uniform institutional exit from Bitcoin across every product.
Bitwise BITB’s $2.2 Million Inflow Stands Out
BITB was the only fund with a meaningful inflow on October 14, taking in $2.2 million — the largest single inflow of the day. In dollar terms it is tiny next to the $263.6 million that left FBTC and IBIT, but its direction is the point: not every large investor was reducing exposure.
Flows migrating between funds with different fee structures or investor bases can soften a headline outflow number. When one product attracts capital on the same day its rivals bleed, it is a reminder that net category totals can hide offsetting behaviour underneath.
Ethereum ETF Outflows: ETHA’s $110M Exit Tells a Bigger Story
Spot Ethereum ETFs had the weaker day in relative terms. Net outflows reached $129.51 million on October 14, and BlackRock’s ETHA was responsible for about $110 million of that — roughly 85% of the category’s total withdrawals, per SoSoValue.
The ETH picture looks bleaker than Bitcoin’s on several timeframes:
- Persistence: October 13 was the only inflow day for Ethereum funds since September 28, and it brought in just $24.84 million. One modest green day in more than two weeks.
- Weekly totals: Ethereum ETFs lost $138.02 million in the week ending October 2, $542.07 million in the week ending October 9, and another $190.07 million so far this week.
- Shrinking footprint: total net assets for Ethereum ETFs have fallen to $15.20 billion from $17.71 billion on October 1, while cumulative net inflows have slid to $13.07 billion.
- October as a whole: Ether funds have bled well over half a billion dollars this month alone.
Ethereum’s Weaker Relative Position
Ether’s price action matched the flow data. ETH fell around 6.2% in the same 24-hour window to roughly $2,358, nearly twice Bitcoin’s decline, while the ETH/BTC ratio slipped to 0.0292 — a sign of capital de-risking within crypto itself rather than a simple rotation into Ethereum.
Bitcoin’s dominance rising toward 57.2% during the selloff fits the classic risk-off pattern: when allocators trim crypto exposure but do not leave the sector entirely, capital consolidates into the most liquid asset. For now, that asset is Bitcoin, not Ether.
Read More: Strategy’s $370 million Bitcoin buying spree — a corporate buyer accumulating even as ETF flows turn negative
How Crypto ETF Redemptions Actually Reach the Spot Market
ETF flow headlines are often treated as instant buying or selling, but the mechanics are a step removed. Understanding the link between a redemption number and real spot-market pressure is what separates an informed read of these figures from a reactive one.
The Creation and Redemption Process
When investors redeem ETF shares in size, the fund’s authorised participants cancel shares and the fund must pay out the proceeds. For spot crypto products, that frequently means selling some of the underlying Bitcoin or Ether, or arranging the sale through a broker. A $261 million redemption day can therefore translate into genuine spot selling pressure — but the timing is not automatic.
Redemptions can be settled in cash, and large funds manage liquidity buffers. The selling may arrive across the session or be absorbed by market makers without ever becoming visible as a single trade. That is why a flow figure alone does not establish exactly how much selling the spot market absorbed.
Why Timing Muddies Cause and Effect
Bitcoin trades around the clock while US ETF shares trade during stock-market hours, and flow estimates are published after the session closes. The price often reacts to the same news — an inflation report, a selloff in Asian equities, a shift in rate expectations — before the flow number is even known.
This week’s backdrop illustrates the point: markets were already repricing after a hotter-than-expected US inflation reading, with Asian stocks sliding and equity-index futures soft. Both the ETF withdrawals and Bitcoin’s dip below $81,000 may be responding to that same risk-off impulse, rather than the flows causing the price move on their own.
What October’s Swinging ETF Flows Reveal About Sentiment
Zoom out from the October 14 number and October looks like a month that cannot make up its mind. Bitcoin funds have alternated between inflow and outflow days with no sustained run in either direction:
| Session | Bitcoin ETF daily net flow |
|---|---|
| Oct 1 | +$102.67 million |
| Oct 2 | +$189.84 million |
| Oct 5 | -$89.90 million |
| Oct 6 | +$118.86 million |
| Oct 7 | -$487.07 million |
| Oct 8 | -$244.13 million |
| Oct 9 | +$21.13 million |
| Oct 12 | -$65.40 million |
| Oct 13 | +$175.62 million |
| Oct 14 | -$261.46 million |
Source: daily net flow estimates reported by SoSoValue.
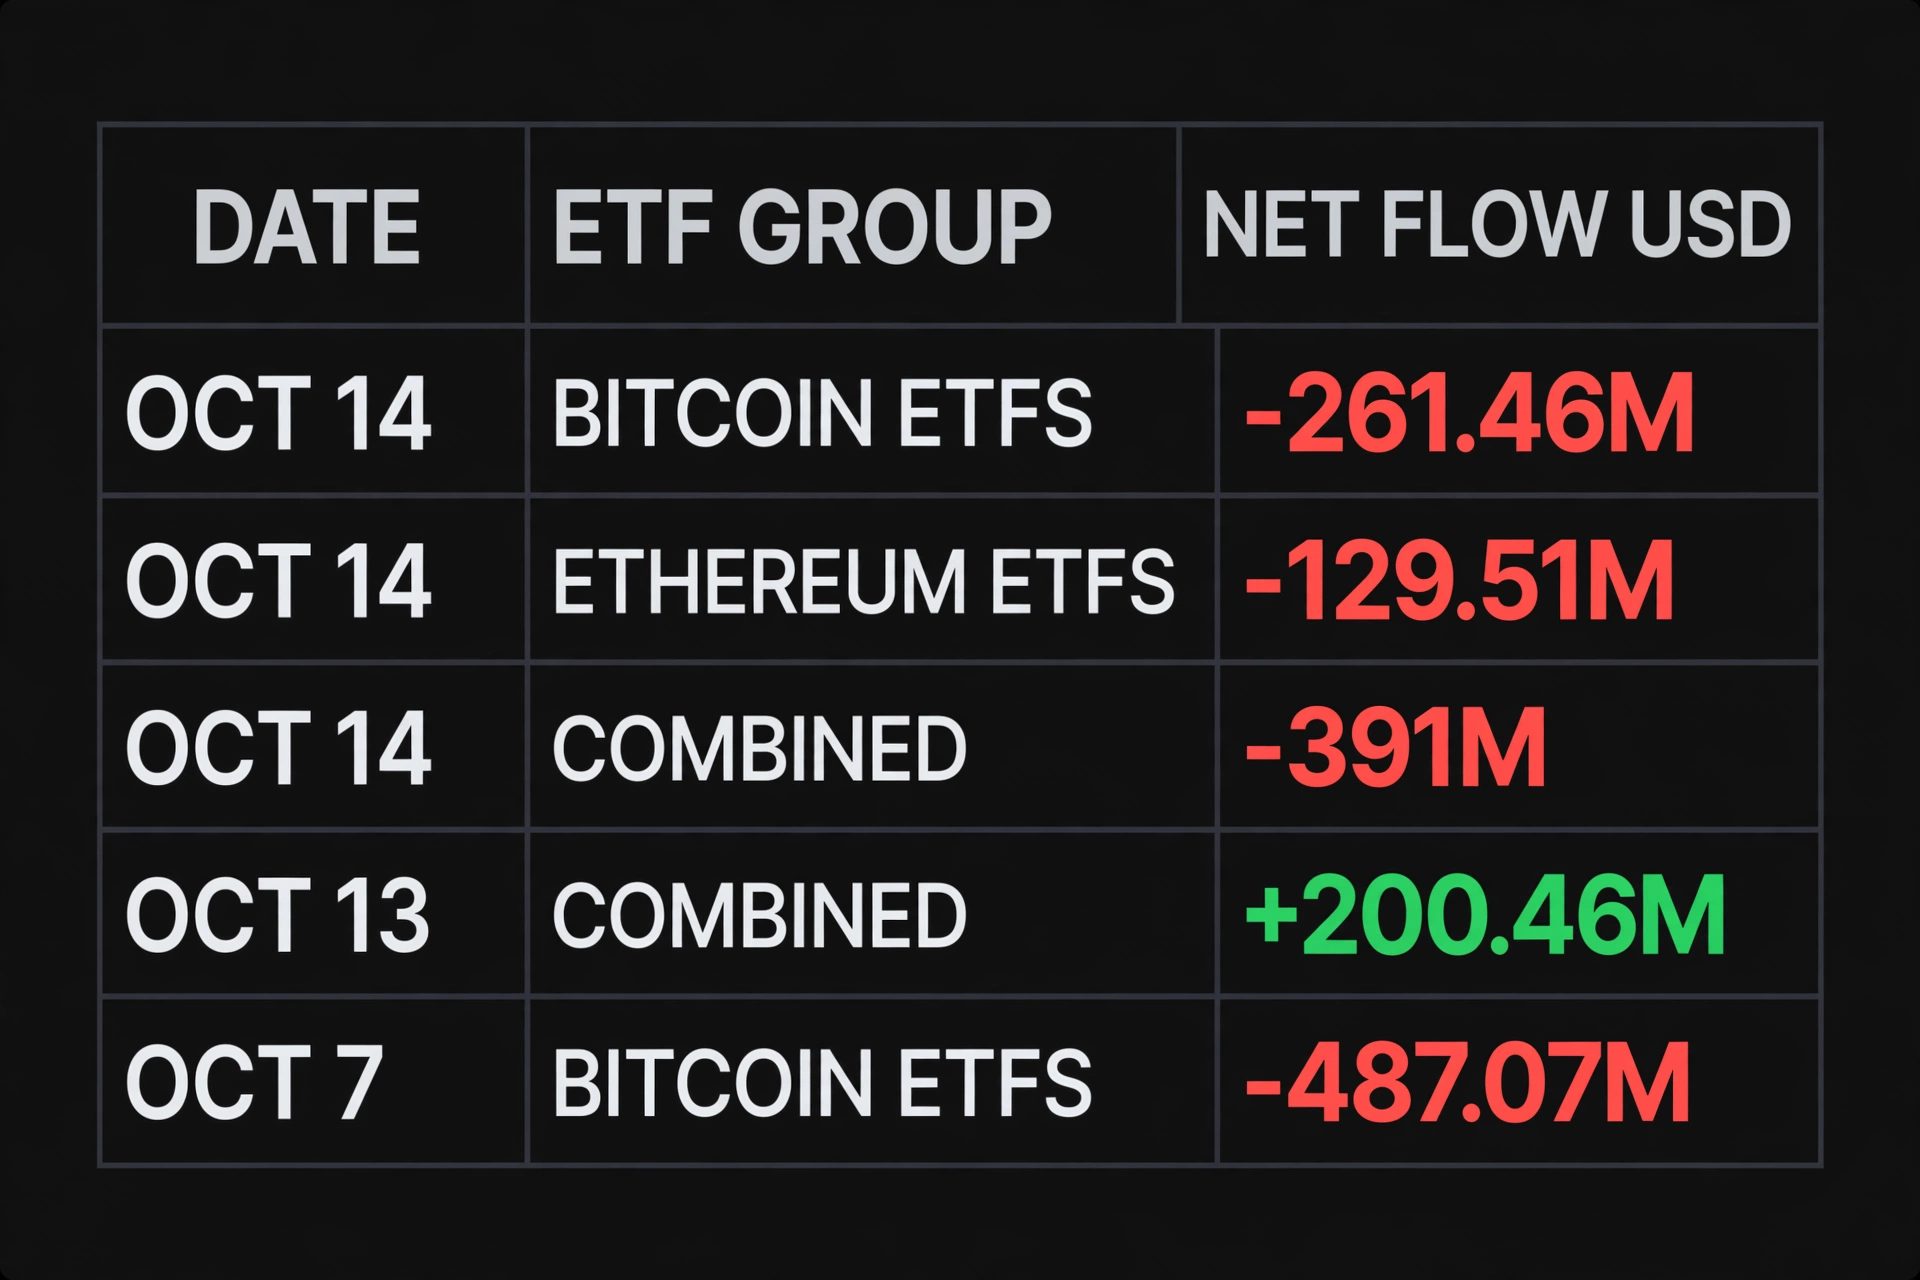
The weekly numbers carry the same stop-start rhythm. Bitcoin ETFs have recorded $151.25 million in net outflows so far this week, following $681.10 million of outflows in the week ending October 9 — a week that included the $487.07 million exit on October 7, the heaviest single-day withdrawal of the month.
Put the $391 Million Day Against the Cumulative Total
A $391 million combined outflow day sounds dramatic until it is placed against the capital these products already hold. Cumulative net inflows for US spot Bitcoin ETFs stand at $56.96 billion, down only slightly from $57.82 billion on October 6. Total net assets have fallen to $104.83 billion from $110.77 billion on October 5 — a decline that reflects both redemptions and the mark-to-market effect of Bitcoin’s falling price.
That does not make the outflow meaningless: sustained withdrawals weaken one of Bitcoin’s key institutional demand channels and weigh on sentiment. But a single red day representing well under one percent of cumulative inflows is a sentiment signal, not a structural break. The risk builds only if the red days start stringing together across multiple weeks and multiple funds.
Bitcoin Price Near $80,000: Support and Resistance Levels
Bitcoin’s slide from the $83,000–$84,000 region has left it trading just above the $80,226 low printed during the selloff — uncomfortably close to the $80,000 psychological level. The 1-hour structure shows a series of lower highs and lower lows, which keeps sellers in control of the short-term trend until the pattern breaks.
Key Bitcoin Price Levels to Watch
- Immediate support: $80,226, the recent swing low. A daily close below it would open the door to $80,000.
- Psychological support: $80,000. Round numbers tend to attract both defensive bids and stop-loss orders, so a test could be volatile either way.
- Deeper support: roughly $76,000 sits below as the next widely watched zone, with the 200-day moving average near $72,284 beneath that.
- Near-term resistance: $81,000 to $81,500 — the zone Bitcoin must reclaim to relieve immediate pressure.
- Recovery confirmation: $82,000. A sustained move above it would improve the short-term structure.
- Major overhead resistance: $83,000 to $84,000, the region that rejected the last rally attempt.
These are approximate zones based on recent price structure, not confirmed targets. With momentum indicators such as the hourly RSI hovering near oversold territory around 35, a relief bounce is possible at any point — but an oversold reading on its own has never guaranteed one.
What Could Turn Crypto ETF Flows Positive Again
ETF flows follow sentiment, and sentiment currently hinges on the macro calendar. Several developments could rebuild the case for allocations:
- Softer inflation data. This week’s pressure followed a hotter US inflation print that forced investors to reassess rate expectations. A cooler reading in the next data round would ease the same tightening fears that are weighing on risk assets.
- Price stabilization above $80,000. Flows and price have moved together this month — total Bitcoin ETF net assets fell by more than $5 billion across the two heaviest outflow days. A base forming at a major level tends to bring back the buyers who stepped aside during the slide.
- Broader equity recovery. Asian stocks tumbled as much as 5.5% on China chip fears during the same window. Crypto rarely rallies alone when global equities are de-risking.
- A concentrated inflow day. October has shown how quickly the story can flip: the October 13 session’s $200.46 million of combined inflows reversed almost the entire prior day’s weakness. One or two strong creation days would change the weekly arithmetic fast.
None of these are certainties, and flows could equally keep alternating. The honest read is that the trend is undecided, and investors should treat each session’s figure as one data point rather than a verdict.
Risks to Watch If Bitcoin Breaks Below $80,000
A decisive break below $80,000 would be the first clean loss of a major psychological level in this drawdown, and it carries several follow-on risks worth monitoring rather than ignoring.
First, stop-loss and liquidation cascades tend to cluster beneath round numbers. Over $200 million in Bitcoin long positions were liquidated in the latest 24-hour window alone, and a deeper break could trigger another wave. Second, ETF outflows often accelerate after visible technical breakdowns, as momentum-oriented allocators cut exposure — which would show up as larger redemptions in the next few sessions.
Third, Ether’s persistent weakness removes a potential stabilizer. With ETH ETFs bleeding for weeks and ETH/BTC at 0.0292, a Bitcoin breakdown would likely drag the broader market with it rather than being cushioned by altcoin strength.
On the other side of the ledger, heavy capitulation at a round number has historically marked selling climaxes rather than the start of something worse — which is why the price reaction at $80,000, and the ETF flows in the sessions immediately after, will say more than any single-day number can.
Readers unfamiliar with the underlying asset can start with a primer on the Ethereum blockchain, the network behind ETH and the spot Ethereum ETFs discussed above.
Not financial advice: this article is for informational purposes only and does not constitute financial or investment advice. Cryptocurrency markets are volatile, past flow and price patterns do not guarantee future results, and you should conduct your own research or consult a qualified professional before making investment decisions.
Frequently Asked Questions
How much did crypto ETFs lose on October 14, 2026?
US spot Bitcoin and Ethereum ETFs recorded approximately $391 million in combined net withdrawals on October 14, 2026. Spot Bitcoin ETFs lost $261.46 million and spot Ethereum ETFs lost $129.51 million, according to SoSoValue.
Which Bitcoin ETF had the largest outflow?
Fidelity’s FBTC led with $152.7 million in redemptions, followed by BlackRock’s IBIT with $110.9 million in withdrawals, based on Farside Investors’ daily estimates. Bitwise’s BITB was the only notable exception, attracting $2.2 million in inflows.
Why did Bitcoin fall back toward $80,000?
Bitcoin came under pressure from a combination of heavy ETF redemptions, a hotter-than-expected US inflation reading that pushed investors to reassess interest-rate expectations, and weakness in Asian equities. BTC traded near $80,900–$81,000 after approaching the $80,000 area.
Can Bitcoin hold $80,000?
The recent low at $80,226 and the $80,000 psychological level are the key supports to watch. A hold above $80,226 followed by a reclaim of the $81,000–$81,500 zone would set up a possible relief move toward $82,000. A daily close below $80,226 would keep sellers in control and expose roughly $76,000 below. These are approximate zones, not predictions.
Do ETF outflows always push Bitcoin’s price lower?
Not always. Outflows can create real selling pressure through the redemption process, but flows and price often respond to the same macro news, and Bitcoin has held up during outflow spells when other buyers absorbed the selling. Persistence across multiple sessions and broad participation across funds are stronger warning signs than a single day.
Are Ethereum ETFs performing worse than Bitcoin ETFs?
In October, yes. Ethereum ETFs have bled well over half a billion dollars this month, with only one inflow day since September 28, while Bitcoin ETFs have swung between inflows and outflows. Ether also fell harder in price terms, and the ETH/BTC ratio has weakened — suggesting investors are de-risking within crypto rather than rotating into Ethereum.
Conclusion
The October 14 session’s $391 million combined outflow erased the prior day’s recovery and pushed Bitcoin back toward the $80,000 line — but the real story is concentration and context. Nearly all of the Bitcoin ETF damage came from two large funds, Ethereum’s weakness is structural rather than one-day, and the month’s flows have swung both ways with no sustained trend yet established.
For investors, the framework matters more than the headline: watch whether redemptions broaden across funds and persist across sessions, watch how Bitcoin reacts at $80,000, and watch the macro data that is driving both. If $80,000 holds and flows stabilize, this month’s back-and-forth may look like consolidation. If the red days start compounding, the market will find out exactly how much institutional demand is still willing to stay.