

XRP is back in focus after its recent recovery pushed traders to watch the $1.60-$1.65 area more closely. The level has become important in several technical discussions, while Ripple’s latest comments on XRP and stablecoins add another layer to the story.
- Why the $1.65 XRP Level Matters
- What the Current XRP Chart Is Showing
- Dark Defender’s Wave 3 Interpretation
- What Would Make the XRP Setup Stronger?
- Price acceptance above resistance
- Momentum confirmation
- The next resistance zones
- The broader crypto market
- Ripple’s Payment Strategy Adds a Different XRP Angle
- XRP and RLUSD Serve Different Functions
- What XRP Price Prediction Should Watch Next
- XRP Price Prediction: Key Takeaway
XRP was trading around $1.53-$1.54 on September 25, 2026, leaving the market just below the $1.65 area. Recent historical data shows that XRP briefly reached $1.65 on September 23 before pulling back, making the zone particularly relevant when looking at the latest price action.
For XRP price prediction, the key question is not simply whether the token can reach $1.65. Traders are also watching what happens around that level, whether momentum can hold, and how the broader technical structure develops afterward.
Why the $1.65 XRP Level Matters
The $1.65 region has attracted attention because it sits close to a recent swing high and an important area in longer-term technical analysis.
EGRAG Crypto has highlighted the level within a broader XRP market structure. His analysis also looks at longer-term moving averages and a multi-year chart formation. The larger projection includes substantially higher levels, but those targets remain technical scenarios rather than established future prices.
That distinction matters. A chart can identify resistance or project possible extensions, but it cannot guarantee that XRP will reach a particular price.
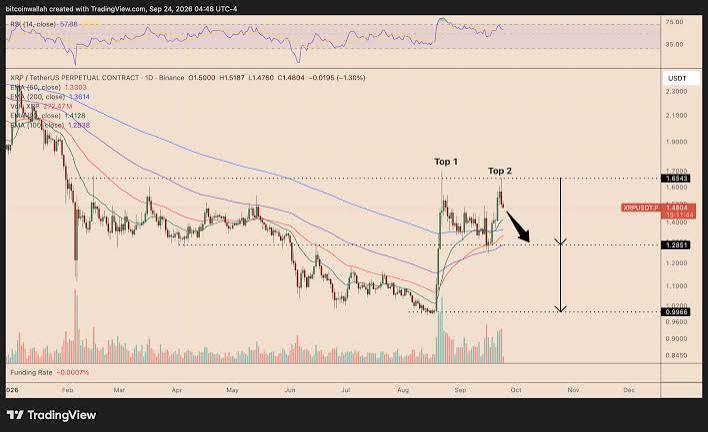
Recent market data shows why $1.65 is being watched. XRP reached approximately $1.65 on September 23 before closing lower, while the following sessions showed a recovery from the pullback.
If XRP can establish itself above a resistance area rather than merely touching it, traders may interpret that differently from a brief intraday move. Conversely, another rejection around the same zone would keep the resistance argument intact.
What the Current XRP Chart Is Showing
The recent price structure has produced several important reference points.
XRP moved down from the upper part of its recent range before recovering. Technical analysts have used Fibonacci retracement levels to measure how much of that decline has been recovered. The levels discussed in the current setup include approximately $1.29, $1.38, $1.44 and $1.57.
These numbers are useful as chart references, but they should not be treated as automatic support or resistance. Their importance depends on how price behaves when it reaches them.
The $1.57 region is particularly close to the current market price. A move through that area would put XRP nearer to the $1.65 zone that has become the focus of the latest discussion.
Above that area, the technical roadmap referenced by analysts includes higher Fibonacci extensions. The previously discussed chart identifies levels around $1.88 and $2.90 as possible extension points.
Those levels describe potential technical destinations. They do not mean XRP is expected to reach them within a specific timeframe.
Read more: SEC Crypto Rules 2026: Staking, Mining and Tokens Explained
Dark Defender’s Wave 3 Interpretation
Another part of the current XRP price discussion comes from Dark Defender’s Elliott Wave analysis.
The analyst compared the recent daily price movement with an earlier September setup that mapped an ABC corrective structure. According to that interpretation, the decline followed the expected correction before XRP began recovering.
The important part of this analysis is the proposed transition into a Wave 3 phase.
In Elliott Wave analysis, Wave 3 is generally interpreted as a potentially strong directional phase within a larger five-wave structure. However, identifying a wave in real time is an analytical interpretation. The structure can change if price action invalidates the underlying count.
That is why traders following this setup are likely to watch the previous correction low, the $1.57 area and the $1.65 region rather than relying on the Wave 3 label alone.
Momentum also matters. The technical setup discussed by the analyst places the daily RSI above its midpoint but below the traditional overbought zone. That combination can indicate improving momentum without showing an extreme reading.
Still, RSI should be considered alongside price structure, volume and broader market conditions rather than used as a standalone XRP price prediction tool.
What Would Make the XRP Setup Stronger?
A sustained move above $1.65 would change the immediate technical picture because the market would be moving beyond a level that has recently acted as a barrier.
Traders would then likely examine whether XRP can remain above the breakout area instead of immediately falling back below it. A failed breakout can produce a very different setup from a sustained move.
There are several things worth watching:
Price acceptance above resistance
A brief move above $1.65 is not necessarily the same as establishing support above it. Multiple closes or continued trading above the zone would provide more information about whether buyers are actually maintaining control.
Momentum confirmation
Indicators such as RSI can help determine whether momentum is strengthening or weakening. A rising price accompanied by improving momentum generally provides a different technical picture from a price rise that occurs while momentum deteriorates.
The next resistance zones
If XRP moves beyond $1.65, analysts may turn toward the higher extension levels already identified in the broader technical setup. These should remain treated as potential chart targets rather than guaranteed destinations.
The broader crypto market
XRP does not trade in isolation. Bitcoin, Ethereum, liquidity conditions, risk appetite and major crypto-market moves can all affect XRP’s short-term behavior.
That means even a technically constructive XRP chart can change quickly if the wider market turns sharply lower.
Ripple’s Payment Strategy Adds a Different XRP Angle
The price discussion is only one part of the current XRP story.
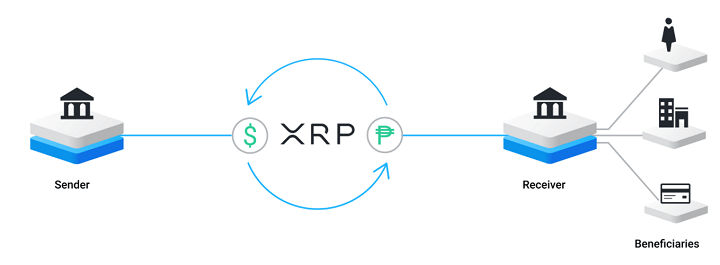
Ripple’s payment infrastructure increasingly supports multiple digital assets rather than depending exclusively on XRP. Ripple’s current payment documentation lists RLUSD, USDC, USDT and fiat as settlement options, depending on the customer’s requirements.
This is relevant because it provides context for recent comments from Ripple CEO Brad Garlinghouse.
Garlinghouse has said he does not consider himself an XRP maximalist and has described XRP and stablecoins as potentially useful for different payment situations. A report on his September 24 comments quoted him as saying that XRP could be the appropriate bridge asset in one situation while a stablecoin could solve another payment problem better.
The comments do not amount to a rejection of XRP. Instead, they describe a payments model in which the asset used can depend on the particular transaction.
That distinction is important when considering XRP’s relationship with Ripple’s business.
XRP and RLUSD Serve Different Functions
XRP and RLUSD are not interchangeable assets.
XRP is the native asset of the XRP Ledger and trades according to market supply and demand. RLUSD, by contrast, is designed as a dollar-denominated stablecoin. Ripple’s terms state that RLUSD is intended as a payment mechanism and that each token is redeemable for one U.S. dollar, subject to the applicable conditions.
Ripple’s payment products currently allow businesses to use several settlement assets. Its documentation specifically states that businesses can pay in, pay out and settle using RLUSD, USDC, USDT or fiat according to their requirements.
Ripple has also continued developing stablecoin settlement on the XRP Ledger. In June 2026, the company announced an expanded partnership with Bitso involving MXNB, an MXN-backed stablecoin, alongside RLUSD for enterprise cross-border payment settlement.
This broader ecosystem means XRP’s role cannot be assessed solely by asking whether every Ripple payment uses XRP.
What XRP Price Prediction Should Watch Next
The immediate technical picture revolves around the area between the current market price and $1.65.
A move toward that resistance would put the latest recovery back under scrutiny. A sustained break could shift attention toward higher technical levels, while another rejection could keep XRP inside its recent trading structure.
The important point is that neither outcome is guaranteed.
For anyone following XRP price prediction models, it makes sense to separate three things: what the market has already done, what analysts expect based on their chart models, and what actually happens next.
The current market has already shown that XRP can reach the $1.65 area and retreat. The next test is whether buyers can produce a stronger move through that region and maintain it.
At the same time, Ripple’s expanding support for stablecoins shows that the company’s payment strategy is broader than XRP alone. That does not remove XRP from the ecosystem; Ripple continues to use the XRP Ledger and XRP in its wider digital-asset infrastructure. But it does mean that XRP’s investment narrative should not be based solely on the assumption that Ripple will use XRP for every payment scenario.
XRP Price Prediction: Key Takeaway
The $1.65 area has become an important reference point in the latest XRP technical discussion because it sits near a recent price high and within longer-term chart structures highlighted by analysts.
A move above that area could bring higher technical projections back into focus, while another rejection would keep the market’s recent resistance structure relevant. Fibonacci levels, RSI and Elliott Wave analysis can help frame those possibilities, but none can guarantee a future XRP price.
Meanwhile, Brad Garlinghouse’s recent comments reinforce a separate point: Ripple’s payment strategy is not based on XRP maximalism. XRP, stablecoins and fiat can have different roles depending on the payment requirement.
For XRP traders and investors, the most useful approach is therefore to watch the actual price action around key levels while keeping analyst projections and Ripple’s business developments in their proper context.
This article is for informational purposes only and does not constitute financial or investment advice. Cryptocurrency markets are highly volatile, and technical projections may not materialize.