

Key Insights
- Dogecoin price is stabilizing between $0.12 and $0.13, a range analysts view as a critical base before a potential move toward $0.18.
- A bull pennant formation on lower timeframes and a descending channel breakout on the weekly chart suggest improving upside probability if $0.14 flips into support.
- DOGE continues to respect the 200-week moving average, reinforcing long-term structural support after months of consolidation.
- Multiple timeframes are aligning technically, signaling early trend recovery rather than speculative excess.
- Analysts emphasize patience, noting that Dogecoin remains in a transition phase rather than an explosive breakout stage.
Dogecoin Price Shows Early Signs of Structural Recovery
Dogecoin price action has entered a phase that many market participants describe as quiet but constructive. After months of sideways trading and declining momentum, DOGE is beginning to display technical signals that point toward a potential trend shift. While price remains modestly priced between $0.12 and $0.13, the broader chart structure suggests the market may be laying the groundwork for a more significant move.
- Key Insights
- Dogecoin Price Shows Early Signs of Structural Recovery
- Dogecoin Price Holds Above Critical Weekly Channel
- Volume Behavior Supports a Controlled Breakout
- Bull Pennant Formation Emerges on Lower Timeframes
- Multi-Timeframe Alignment Improves Probabilities
- Historical Cycle Patterns Draw Renewed Interest
- Sideways Consolidation Signals Supply Absorption
- 200-Week Moving Average Remains a Critical Anchor
- Monthly Structure Shows Market Stability
- Momentum Indicators Reset Without Breakdown
- What Needs to Happen Next for DOGE
- FAQ’s
- Why is Dogecoin price consolidating between $0.12 and $0.13?
- What does the bull pennant pattern mean for DOGE price?
- Why is the $0.14 level important for Dogecoin?
- How significant is the 200-week moving average for DOGE?
- Is Dogecoin entering a new bullish cycle?
- Could Dogecoin reach $0.18 in the near term?
- What risks could invalidate the bullish outlook for Dogecoin?
- Conclusion
This period of consolidation has been marked by reduced volatility, steady volume, and repeated defenses of key support levels. These characteristics often appear when markets transition from bearish exhaustion into accumulation. For Dogecoin, a cryptocurrency historically known for sharp and emotionally driven rallies, this measured behavior stands out.
Rather than impulsive buying or panic selling, the current structure suggests patient positioning by longer-term participants. Analysts caution that this does not guarantee an immediate breakout, but it does indicate that downside risk may be increasingly limited compared to previous months.
As multiple technical indicators begin to align across timeframes, Dogecoin’s price structure is attracting renewed attention from traders who previously remained sidelined.
Dogecoin Price Holds Above Critical Weekly Channel
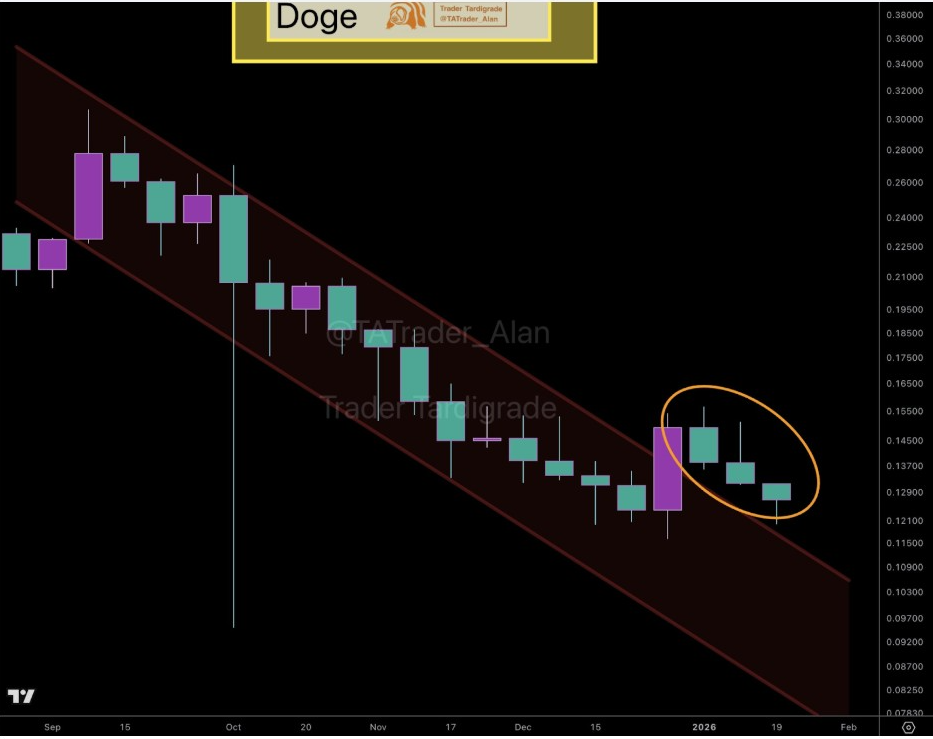
One of the most significant technical developments in recent weeks has been Dogecoin’s breakout from a long-standing descending channel on the weekly chart. This channel had guided price lower since late 2023, reflecting persistent selling pressure and lower highs.
The recent weekly close above the channel boundary marks a potential shift in market dynamics. According to technical analyst Trader Tardigrade, DOGE candles have now moved outside the previously dominant bearish structure. While this alone does not confirm a new uptrend, it often signals that sellers are losing control.
Historically, channel breakouts do not always lead to immediate rallies. In many cases, price enters a stabilization phase where it tests the breakout zone multiple times. This behavior allows the market to validate the breakout and absorb remaining sell orders.
At present, Dogecoin remains below major historical resistance zones formed during earlier bull cycles. This positioning supports a cautious interpretation of the breakout. Rather than indicating aggressive bullish continuation, the structure suggests a gradual transition from bearish pressure to neutral or mildly bullish conditions.
Analysts note that sustained weekly closes above the former channel increase the probability that the breakout is legitimate. Failure to hold this area, however, would place DOGE back into consolidation rather than reversal territory.
Volume Behavior Supports a Controlled Breakout
Volume patterns provide additional insight into the nature of Dogecoin’s recent move. Unlike speculative spikes driven by hype, the breakout from the descending channel occurred alongside moderate and consistent volume.
This type of volume profile is often viewed positively in technical analysis. Sudden, excessive volume can indicate emotional trading and short-term speculation, which increases the likelihood of sharp reversals. In contrast, controlled volume suggests accumulation rather than distribution.
DOGE’s current volume behavior aligns with the idea that institutional or longer-term participants may be gradually building positions. While Dogecoin does not traditionally attract the same institutional flows as larger assets like Bitcoin or Ethereum, volume discipline still plays a critical role in validating technical signals.
For now, volume remains supportive rather than explosive. Analysts interpret this as a sign that Dogecoin’s market is stabilizing rather than overheating.
Bull Pennant Formation Emerges on Lower Timeframes
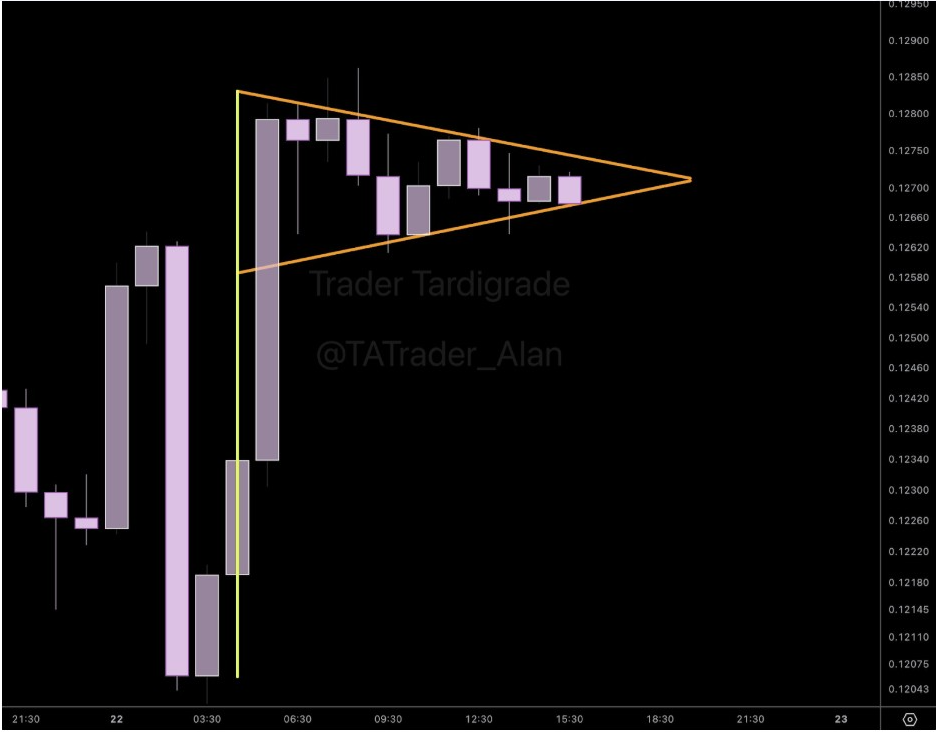
On shorter timeframes, Dogecoin price action has formed a bull pennant, a continuation pattern that often appears after a strong directional move. This pattern consists of a sharp upward advance followed by a period of consolidation within converging trendlines.
The formation suggests that buyers and sellers are temporarily in equilibrium, with neither side exerting full control. Over time, price compression within the pennant builds energy, which is eventually released through a breakout.
Trader Tardigrade highlighted that DOGE is currently trading near the apex of this structure on the hourly chart. Candles continue to form higher lows, indicating that buyers are stepping in earlier with each pullback.
For the bull pennant to resolve to the upside, price must break decisively above the upper trendline with accompanying volume expansion. Without that confirmation, the pattern remains neutral.
A breakdown below the lower boundary would invalidate the bullish thesis in the short term and potentially send DOGE back toward previous support levels. As a result, traders are closely monitoring this compression zone for directional cues.
Multi-Timeframe Alignment Improves Probabilities
One of the more encouraging aspects of Dogecoin’s current setup is the alignment between higher-timeframe and lower-timeframe structures. The weekly channel breakout and the intraday bull pennant both point toward potential upside continuation.
When technical signals align across multiple timeframes, the probability of a successful move often increases. This does not eliminate risk, but it does reduce the likelihood that the setup is purely noise.
The $0.13 to $0.14 region has emerged as a near-term decision zone. A clean break above this range, followed by a successful retest, could open the door for a move toward $0.18.
Until that level is reclaimed, analysts emphasize patience. Dogecoin remains in a developing structure rather than a confirmed breakout.
Historical Cycle Patterns Draw Renewed Interest
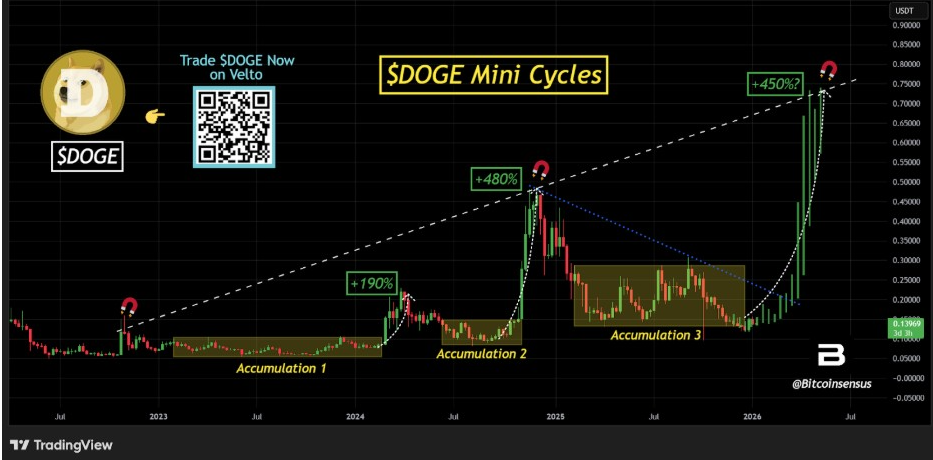
Beyond short-term technical formations, some analysts are examining Dogecoin through a cycle-based lens. According to analysis shared by Bitcoinsensus, DOGE has historically experienced extended accumulation phases followed by explosive rallies.
The first major accumulation phase preceded a rally of approximately 190%. The second accumulation phase resulted in a much larger expansion of roughly 480%. Current price behavior appears to resemble a third accumulation structure.
If this pattern were to repeat, some projections suggest the possibility of a 400% to 450% move over the long term. However, analysts caution that historical repetition is not guaranteed, particularly as market conditions evolve.
Dogecoin’s market structure today differs significantly from earlier cycles. Liquidity is deeper, market participants are more informed, and speculative mania is less pronounced than during previous meme-driven rallies.
Nevertheless, cycle analysis remains a popular tool among traders seeking to contextualize price behavior within broader historical trends.
Sideways Consolidation Signals Supply Absorption
Extended periods of sideways trading are often misunderstood as weakness. In reality, consolidation phases play a crucial role in market structure by allowing supply to be absorbed without dramatic price declines.
Dogecoin’s current range-bound behavior suggests that sellers are being gradually absorbed by buyers willing to accumulate at these levels. The absence of sharp breakdowns reinforces this interpretation.
From a structural standpoint, this type of consolidation often precedes trend continuation or reversal. The longer the market trades within a tight range, the more significant the eventual breakout tends to be.
That said, consolidation alone does not determine direction. Confirmation through volume, momentum, and support-resistance dynamics remains essential.
200-Week Moving Average Remains a Critical Anchor
One of the most important long-term indicators supporting Dogecoin’s structure is the 200-week moving average. Analyst CryptoSurf highlighted that DOGE continues to respect this level, which has historically served as a strong support zone.
In previous market cycles, interactions with the 200-week moving average marked transitional periods that eventually led to sustained rallies. While price did not immediately surge, the level provided a foundation for long-term accumulation.
DOGE holding above or near this moving average suggests that downside risk may be limited unless broader market conditions deteriorate significantly. However, it does not guarantee immediate upside momentum.
Rebuilding bullish momentum from such levels typically requires time, patience, and consistent demand.
Monthly Structure Shows Market Stability
Looking at monthly charts, Dogecoin continues to consolidate above its previous cycle lows. This is a key distinction from outright bearish markets, where price often breaks down decisively below historical support.
The current structure reflects a market that is absorbing sell pressure rather than capitulating. Monthly volatility has compressed significantly, a condition that often precedes large directional moves.
Compression does not indicate direction on its own, but it does signal that the market is preparing for expansion. Whether that expansion favors bulls or bears depends on how price reacts to upcoming resistance levels.
Momentum Indicators Reset Without Breakdown
Momentum oscillators across higher timeframes have gradually reset from elevated levels. This reset reduces the risk of overheating and excessive speculation, which often precedes sharp corrections.
CryptoSurf noted that this momentum reset allows Dogecoin to build a more sustainable base compared to previous cycles driven by hype. Rather than chasing rapid price increases, the market appears to be stabilizing organically.
This environment may not appeal to short-term traders seeking quick gains, but it can be favorable for longer-term positioning.
What Needs to Happen Next for DOGE
Despite improving structure, Dogecoin has not yet confirmed a full trend reversal. Several technical milestones remain critical:
- $0.14 must flip into support to validate near-term bullish continuation.
- Volume must expand on breakouts to confirm participation.
- Weekly closes above former resistance zones are required to sustain momentum.
- Failure to hold the channel breakout area would delay the bullish thesis.
Until these conditions are met, analysts continue to describe DOGE as being in a transition phase rather than a confirmed uptrend.
Read More: Binance Coin Price Forecast as BSC Activity and Fees Surge
FAQ’s
Why is Dogecoin price consolidating between $0.12 and $0.13?
Dogecoin is consolidating in this range as buyers and sellers reach temporary equilibrium. This phase allows the market to absorb selling pressure while building a stable base for a potential directional move.
What does the bull pennant pattern mean for DOGE price?
A bull pennant indicates price compression following an upward move. If confirmed with volume, it typically signals continuation to the upside, suggesting DOGE could attempt a breakout from its current range.
Why is the $0.14 level important for Dogecoin?
The $0.14 level represents a key resistance zone. A successful break and retest above this level would likely confirm bullish momentum and open the path toward higher targets such as $0.18.
How significant is the 200-week moving average for DOGE?
The 200-week moving average is a critical long-term support indicator. Dogecoin holding above this level historically signals structural strength and reduces downside risk during consolidation phases.
Is Dogecoin entering a new bullish cycle?
While technical indicators show early signs of recovery, DOGE has not yet confirmed a full bullish cycle. Analysts consider the market to be in a transition or accumulation phase rather than a confirmed uptrend.
Could Dogecoin reach $0.18 in the near term?
A move toward $0.18 is possible if Dogecoin breaks above $0.14 with strong volume and maintains higher support levels. Without confirmation, this target remains speculative.
What risks could invalidate the bullish outlook for Dogecoin?
The bullish setup could weaken if DOGE fails to hold above key support levels or if broader crypto market sentiment turns negative. A breakdown below consolidation support would delay any upside scenario.
Conclusion
Dogecoin price is showing early but meaningful signs of recovery after months of consolidation. Technical structures across multiple timeframes suggest improving market health, while long-term indicators such as the 200-week moving average reinforce structural support.
Rather than signaling immediate explosive upside, the current setup points to a gradual rebuilding process. Analysts emphasize patience, risk management, and confirmation over speculation.
If Dogecoin successfully reclaims higher resistance levels and sustains momentum, a move toward $0.18 becomes increasingly plausible. Until then, DOGE remains a closely watched asset in a developing technical phase that could shape its next major trend.