
Solana (SOL) is once again commanding attention across the cryptocurrency market as price action, on-chain metrics, and ecosystem fundamentals converge into a compelling bullish narrative. Despite a modest pullback in recent days, Solana’s broader technical structure and rapidly improving network activity suggest that the current consolidation phase may be setting the stage for another significant upside move.
- Market Overview: Solana Consolidates After a Strong Recovery Rally
- Solana Price Technical Analysis: Cup-and-Handle Pattern Takes Shape
- Understanding the Cup-and-Handle Pattern
- Cup Formation on the 12-Hour Chart
- Handle Development and Controlled Pullback
- Key Indicators Supporting the Bullish Setup
- Fibonacci Retracement Alignment
- Supertrend Indicator Remains Bullish
- 50-Period Exponential Moving Average (EMA)
- Bullish Price Targets and Invalidation Levels
- Solana Network Fundamentals: Active Addresses Surge
- Transaction Volume Reflects Real Network Usage
- Revenue and Fee Generation Strengthen the Fundamental Case
- Solana Dominates the DEX Landscape
- Alpenglow Upgrade: A Major Catalyst Ahead
- Institutional Demand: SOL ETFs Continue to Attract Capital
- Broader Market Implications for Solana
- FAQ’s
- Conclusion
At the center of this outlook is the formation of a classic cup-and-handle pattern on the 12-hour chart—a widely followed bullish continuation setup. At the same time, Solana is witnessing a sharp rise in active addresses, transaction throughput, decentralized exchange (DEX) volume, and institutional participation through exchange-traded funds (ETFs).
This analysis examines Solana’s price structure, key technical indicators, network growth metrics, DEX dominance, upcoming protocol upgrades, and institutional demand to assess where SOL may be heading next.
Market Overview: Solana Consolidates After a Strong Recovery Rally
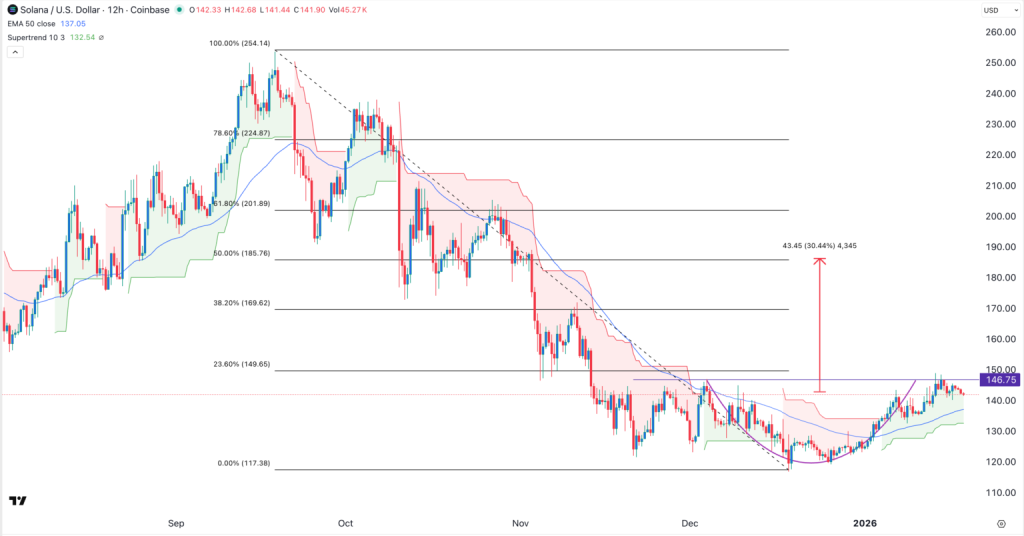
Solana price has recently retraced from a local high of $148 recorded on January 13, pulling back to the $142 region. While short-term traders may view this as a pause or mild correction, a broader technical perspective suggests that this move is part of a healthy consolidation within an ongoing recovery trend.
The prior rally began after Solana rebounded from its year-to-date low of $117 on December 18. That recovery represented a gain of more than 25% in under a month, reflecting renewed buying interest after a prolonged period of downside pressure earlier in the cycle.
Rather than reversing sharply from the highs, SOL has instead entered a controlled pullback phase—often interpreted as a bullish pause rather than a trend reversal. This behavior is consistent with continuation patterns, particularly when supported by improving fundamentals.
Solana Price Technical Analysis: Cup-and-Handle Pattern Takes Shape
Understanding the Cup-and-Handle Pattern
The cup-and-handle pattern is one of the most widely recognized bullish continuation formations in technical analysis. It typically forms after a sustained recovery from a prior decline and consists of two main components:
- The Cup: A rounded bottom that reflects gradual accumulation and the transition from selling pressure to buying dominance.
- The Handle: A shallow pullback or consolidation near the top of the cup, which allows the market to absorb short-term profit-taking before attempting a breakout.
When confirmed, this pattern often leads to strong upside continuation, particularly when aligned with broader trend support and rising volume.
Cup Formation on the 12-Hour Chart
On the 12-hour Solana chart, the cup began forming after SOL bottomed near $117 in mid-December. From that low, price gradually recovered, forming a rounded base rather than a sharp rebound. This structure suggests organic accumulation rather than speculative excess.
The recovery culminated near $148, which now represents the upper boundary of the cup. Importantly, this level coincides with a key Fibonacci retracement zone, reinforcing its technical significance.
Handle Development and Controlled Pullback
Following the rally to $148, Solana price entered a mild pullback phase, drifting lower toward the $142 area. This pullback has been orderly, with no signs of panic selling or structural breakdown.
Such behavior aligns with the “handle” portion of the pattern, where price consolidates just below resistance, allowing momentum indicators to reset and buyers to regroup.
As long as SOL remains above critical support zones, this handle formation strengthens the bullish case rather than undermining it.
Key Indicators Supporting the Bullish Setup
Fibonacci Retracement Alignment
The upper boundary of the cup aligns closely with the 23.6% Fibonacci retracement level drawn from the prior major swing high to the December low. This confluence adds credibility to the resistance zone and enhances the importance of a breakout above it.
The next major Fibonacci targets lie at:
- 38.2% retracement near $170
- 50% retracement near $185
A confirmed breakout above the cup’s rim would place these levels firmly on traders’ radar.
Supertrend Indicator Remains Bullish
Solana price continues to trade above the Supertrend indicator on the 12-hour timeframe. This suggests that the prevailing trend remains bullish and that pullbacks are being treated as buying opportunities rather than trend reversals.
As long as price holds above this indicator, trend-following traders are likely to maintain long exposure.
50-Period Exponential Moving Average (EMA)
The 50-period EMA has also provided dynamic support throughout the recent pullback. SOL has repeatedly bounced from this moving average, reinforcing its role as a key trend guide.
Sustained trading above the 50 EMA typically reflects bullish market structure, especially when combined with higher lows.
Bullish Price Targets and Invalidation Levels
Upside Targets
If Solana price breaks above the $148–$150 resistance zone with strong volume, the cup-and-handle pattern would be confirmed. In that scenario, technical projections point toward:
- $170 (38.2% Fibonacci retracement)
- $185 (50% Fibonacci retracement)
Beyond these levels, momentum-driven extensions could come into play, particularly if broader market conditions remain supportive.
Bearish Invalidation Scenario
Despite the bullish outlook, risk management remains essential. A decisive drop below $130 would invalidate the cup-and-handle structure and signal that sellers have regained control.
Such a move would likely shift focus back toward lower support zones and delay any upside continuation.
Solana Network Fundamentals: Active Addresses Surge
Technical setups are significantly strengthened when supported by improving fundamentals. In Solana’s case, on-chain data reveals one of the strongest growth profiles in the crypto industry.
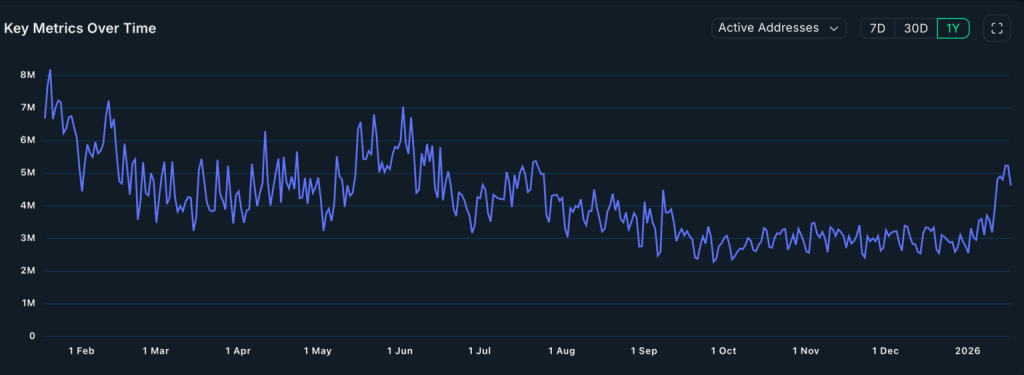
Active Addresses Increase by 18%
According to data compiled by Nansen, Solana’s number of active addresses surged by 18% over the past 30 days, reaching more than 70 million. This makes Solana the most active blockchain network by this metric.
For comparison:
- Ethereum recorded approximately 13.25 million active addresses
- BNB Chain reached 42 million
- Aptos and Polygon recorded 14 million and 11.7 million, respectively
This disparity highlights Solana’s growing dominance in user activity and network engagement.
Transaction Volume Reflects Real Network Usage
Active addresses alone can sometimes be misleading if not accompanied by meaningful transaction activity. However, Solana’s transaction volume tells a compelling story.
Transaction Throughput Outpaces Competitors
Solana processed over 1.8 billion transactions in the past 30 days, representing a 1% increase over the previous period. This figure dwarfs transaction counts on competing networks:
- Ethereum processed approximately 59 million transactions
- BNB Chain and Tron combined processed around 734 million
This massive throughput underscores Solana’s position as a high-performance blockchain designed for real-world usage rather than speculative activity alone.
Revenue and Fee Generation Strengthen the Fundamental Case
The surge in activity has translated directly into higher network revenues. Solana has now become the second most profitable blockchain in the crypto industry, trailing only Tron.
Fee Revenue Growth
In the past month alone, Solana generated over $18 million in network fees, representing a 24% month-over-month increase. Rising fees often signal increased demand for block space and growing economic activity within the ecosystem.
This revenue growth enhances Solana’s long-term sustainability and attractiveness to developers, validators, and investors alike.
Solana Dominates the DEX Landscape
One of the most striking developments in Solana’s ecosystem is its rapid ascent to dominance within the decentralized exchange sector.
Record DEX Volume
Protocols built on Solana processed over $2.9 billion in DEX volume in the last 24 hours and approximately $101 billion over the past 30 days.
By comparison:
- Ethereum-based DEXs processed around $41 billion
- BNB Chain processed approximately $43 billion
This means Solana is handling more DEX volume than Ethereum, BNB Chain, and Base combined.
Why Solana DEXs Are Thriving
Several factors contribute to this surge:
- Low transaction fees
- High throughput and fast settlement times
- Growing ecosystem of DeFi protocols
- Improved user experience compared to congested networks
As more traders migrate toward cost-efficient platforms, Solana continues to capture market share.
Alpenglow Upgrade: A Major Catalyst Ahead
Looking forward, Solana’s fundamentals may receive an additional boost from the upcoming Alpenglow upgrade, expected to launch this quarter.
Key Features of the Alpenglow Upgrade
The Alpenglow upgrade introduces several significant improvements, including:
- Faster transaction processing
- Architectural redesign for enhanced scalability
- Improved network efficiency and resilience
These changes are expected to further strengthen Solana’s position as a leading high-performance blockchain.
Potential Impact on Price and Adoption
Historically, major protocol upgrades often act as catalysts for increased developer interest, user adoption, and speculative momentum. If Alpenglow delivers as expected, it could reinforce Solana’s already strong fundamentals and support higher price levels over time.
Institutional Demand: SOL ETFs Continue to Attract Capital
Institutional participation has become an increasingly important driver of crypto market dynamics. In Solana’s case, ETF inflows suggest sustained interest from professional investors.
Recent ETF Inflows
Despite a brief $2.2 million outflow, Solana-focused ETFs recorded $46 million in inflows last week. Total net inflows now exceed $863 million, with assets under management reaching approximately $1.21 billion.
Major Solana ETF Holders
- Bitwise Solana ETF: Over $804 million in assets
- Grayscale GSOL
- Fidelity FSOL
- VanEck VSOL
These inflows indicate confidence in Solana’s long-term prospects, even during periods of short-term price consolidation.
Broader Market Implications for Solana
Solana’s combination of strong technical structure and accelerating fundamentals positions it favorably within the broader crypto market. Unlike purely speculative rallies, the current setup is underpinned by tangible network usage and revenue growth.
As regulatory clarity evolves and institutional products continue to expand, Solana may increasingly be viewed as a core infrastructure asset rather than a high-risk altcoin.
Read More: Dogecoin Poised for a Breakout as $0.15 Resistance Comes Into Focus
FAQ’s
What bullish pattern is Solana forming right now?
Solana has formed a cup-and-handle pattern on the 12-hour chart, which is widely considered a bullish continuation signal in technical analysis.
What are the key resistance and breakout levels for Solana price?
The main resistance zone is around $148–$150. A sustained breakout above this area could open the door to higher targets near $170 and $185.
How strong is Solana’s network activity compared to other blockchains?
Solana currently leads the industry in active addresses and transaction volume, with over 70 million active addresses and 1.8 billion transactions in the last 30 days.
Why is Solana’s DEX volume important for price outlook?
Rising DEX volume indicates strong on-chain demand and real usage of the network. Solana now processes more DEX volume than Ethereum and BNB Chain combined, supporting a bullish long-term outlook.
What could invalidate Solana’s bullish price setup?
A decisive drop below the $130 support level would invalidate the cup-and-handle pattern and signal increased downside risk for Solana price.
Conclusion
Solana price is currently consolidating after a strong recovery, but the broader evidence points toward a constructive setup rather than exhaustion. The cup-and-handle pattern on the 12-hour chart suggests bullish continuation potential, while rising active addresses, record DEX volume, growing fee revenue, and ETF inflows provide robust fundamental support.
A confirmed breakout above the $148–$150 resistance zone could open the door to higher targets near $170 and $185. Conversely, a breakdown below $130 would invalidate the bullish thesis and warrant caution.
For now, Solana appears to be in a phase of strategic consolidation—a period that often precedes meaningful trend expansion.