
Key Insights
XRP price is stabilizing near the $2.01 level as a falling wedge pattern develops on lower timeframes, signaling a possible bullish reversal.
Momentum indicators, including a weekly MACD crossover, suggest bearish pressure is weakening after an extended downtrend.
The $1.96–$2.00 zone remains a critical support region that must hold to maintain the bullish technical structure.
Overhead resistance near $2.23 and $2.75 defines potential upside targets if a confirmed breakout occurs.
Broader macro narratives around digital payments and institutional blockchain adoption continue to shape long-term XRP sentiment.
- Key Insights
- XRP at a Technical Crossroads
- XRP Price Action Overview: Stabilization After a Prolonged Pullback
- Falling Wedge Pattern Emerges on Lower Timeframes
- Understanding the Falling Wedge Structure
- Price Interaction Near the Wedge Base
- Breakout Projection and the $2.23 Target
- Momentum Indicators: Weekly MACD Signals Potential Shift
- Structural Analysis: Key Support and Resistance Zones
- The Importance of the $1.96–$2.00 Support Range
- Overhead Resistance at $2.24 and $2.75
- Curved Bottom Formations and Accumulation Signals
- Volume and Market Participation
- Macro Context: Payments, Institutions, and Ripple’s Narrative
- Risk Factors and Alternative Scenarios
- Short-Term, Medium-Term, and Long-Term Outlook
- FAQ’s
- What is the current technical outlook for XRP?
- What is a falling wedge pattern and why is it important for XRP?
- What does the weekly MACD indicate for XRP?
- What are the key support levels for XRP in the short term?
- What price level would confirm the potential breakout?
- What are the next major resistance targets if XRP breaks out?
- How do broader market trends affect XRP’s price outlook?
- Conclusion
XRP at a Technical Crossroads
XRP has spent recent weeks navigating a period of consolidation following a sustained pullback from its earlier highs. After facing repeated rejections near upper resistance zones, the token entered a corrective phase that tested investor conviction and market structure. Now, as price action compresses and volatility narrows, traders are increasingly focused on whether XRP is preparing for a meaningful directional move.
Multiple technical indicators across different timeframes are beginning to align. Short-term charts suggest compression within a falling wedge pattern, while higher timeframe indicators hint at a gradual shift in momentum. Together, these developments point to a potential transition phase for XRP—one where selling pressure may be losing dominance and buyers are cautiously re-entering.
However, confirmation remains critical. XRP is not yet in a clear uptrend, and failed breakouts in the past have made market participants more selective. The coming sessions could prove decisive in determining whether XRP resumes a bullish trajectory or remains locked in a broader consolidation range.
XRP Price Action Overview: Stabilization After a Prolonged Pullback
XRP’s recent price behavior reflects a classic post-downtrend stabilization phase. After weeks of lower highs and lower lows, price movement has slowed, and trading ranges have narrowed. This environment typically precedes one of two outcomes: a continuation of the prevailing trend or a reversal driven by exhaustion of sellers.
Currently, XRP is trading close to the psychologically important $2.00 level. This area has historically acted as both support and resistance, making it a key reference point for market participants. The ability of buyers to repeatedly defend this zone suggests that demand remains present, even as broader sentiment stays cautious.
From a market structure perspective, the most important observation is that downside momentum appears to be weakening. Each successive sell-off has resulted in smaller extensions lower, while rebounds are becoming more responsive. This behavior often signals that the market is transitioning from distribution to accumulation.
Falling Wedge Pattern Emerges on Lower Timeframes
Understanding the Falling Wedge Structure
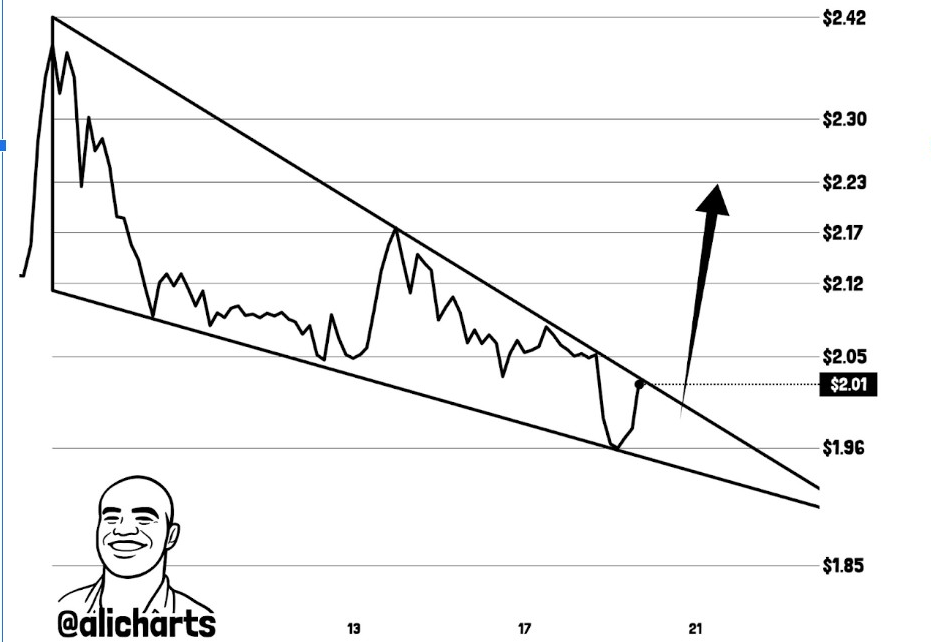
On the four-hour chart, XRP has formed a falling wedge pattern, a technical structure commonly associated with bullish reversals. A falling wedge is characterized by downward-sloping support and resistance lines that converge over time, reflecting a gradual loss of selling pressure.
Unlike a simple downtrend channel, a falling wedge shows diminishing momentum. Sellers continue to push prices lower, but with less conviction on each attempt. Meanwhile, buyers begin stepping in earlier, tightening the range.
Ali Charts highlighted this pattern as a classic reversal setup, particularly when it forms after an extended decline. Historically, falling wedges often resolve to the upside once price breaks above the upper resistance trendline.
Price Interaction Near the Wedge Base
XRP recently traded near the $2.01 area, which sits close to the lower boundary of the falling wedge. This region has acted as a demand zone, with buyers defending it during recent sessions. Importantly, the bounce from this level formed a higher reaction low, a subtle but meaningful shift in short-term structure.
Higher lows within a falling wedge increase the probability of a bullish breakout. They indicate that buyers are becoming more aggressive, stepping in sooner rather than waiting for deeper pullbacks.
However, until price decisively breaks above the wedge’s upper resistance, the pattern remains unconfirmed. Traders remain cautious, watching for a strong close above resistance accompanied by expanding volume.
Breakout Projection and the $2.23 Target
Ali Charts’ projection places a potential upside target around $2.23 if the falling wedge breakout is confirmed. This level aligns with previous reaction zones and short-term resistance clusters, adding technical significance.
A move toward $2.23 would represent more than just a local bounce. It would mark a reclaim of a key price level that previously acted as support before the breakdown. Successfully flipping this zone into support could open the door for further upside extensions.
That said, failed breakouts are common in choppy markets. A rejection near wedge resistance would likely result in continued consolidation rather than immediate downside acceleration, keeping XRP range-bound in the short term.
Momentum Indicators: Weekly MACD Signals Potential Shift
What the MACD Reveals
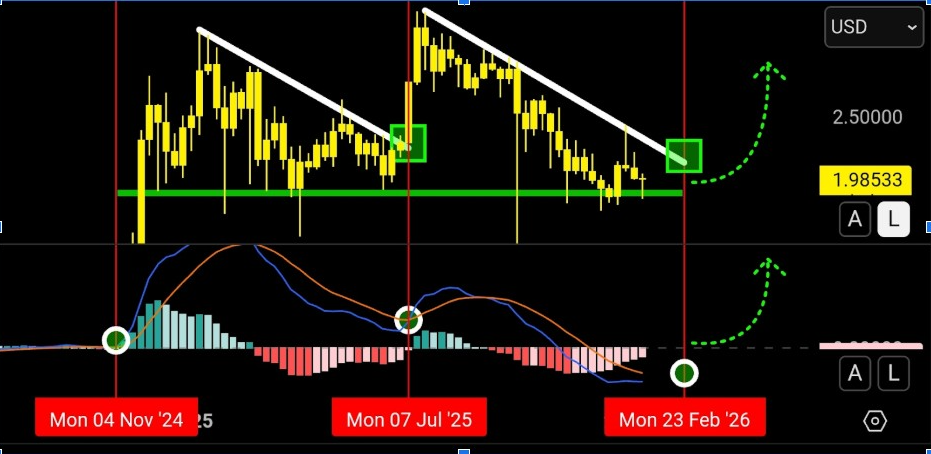
Momentum indicators provide valuable insight into trend strength and exhaustion. On the weekly timeframe, XRP’s Moving Average Convergence Divergence (MACD) is showing early signs of a bullish crossover.
A bullish MACD cross occurs when the MACD line moves above the signal line, often signaling a transition from bearish to bullish momentum. While not a guarantee of immediate price appreciation, this signal has historically preceded multi-week recoveries in XRP during past cycles.
ChartNerd highlighted this development, noting that it comes after an extended period of downside pressure—exactly the type of environment where momentum reversals tend to emerge.
Slowing Bearish Momentum
In addition to the crossover signal, the MACD histogram bars have begun contracting. This suggests that bearish momentum is weakening, even if bullish momentum has not yet fully taken control.
Such contraction often appears before trend reversals or prolonged consolidation phases. When combined with strong structural support levels, it strengthens the case for stabilization rather than continued aggressive selling.
However, experienced traders emphasize the importance of confirmation. Weekly indicators are slow-moving by design, and premature signals can fail if price structure does not follow through.
Descending Weekly Resistance Still in Play
Despite improving momentum signals, XRP continues to face descending resistance on the weekly chart. This trendline has capped price advances multiple times in recent months, making it a formidable technical barrier.
A clean break above this resistance would significantly improve the bullish outlook. It would signal that buyers have regained control of the broader trend rather than just the short-term structure.
Until such a breakout occurs, XRP remains technically within a wider consolidation range. Traders are therefore watching weekly closes closely for confirmation of trend change.
Structural Analysis: Key Support and Resistance Zones
The Importance of the $1.96–$2.00 Support Range
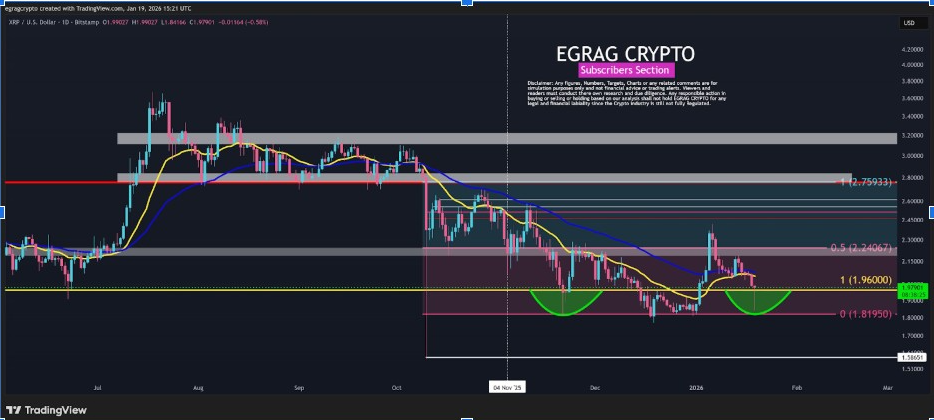
On the daily timeframe, analysts such as EGRAG Crypto have emphasized the importance of structural levels over short-term volatility. One of the most critical zones is the $1.96–$2.00 range.
This area has served as a reaction zone multiple times throughout XRP’s recent price history. In previous market phases, it acted as both resistance and support, making it a high-liquidity region where significant trading activity occurs.
The current defense of this zone suggests renewed buyer interest. If price continues to hold above this range, it strengthens the argument that XRP is forming a base rather than preparing for another leg down.
Overhead Resistance at $2.24 and $2.75
Above current price levels, EGRAG Crypto identified major resistance zones around $2.24 and $2.75. These levels correspond to prior consolidation bands and distribution areas.
Price interaction with these zones is likely to be volatile. Traders often take profits near such levels, while short sellers may attempt to fade rallies. As a result, even if XRP breaks higher, the path upward is unlikely to be smooth.
A decisive breakout above $2.24 would mark a significant technical milestone, potentially shifting market sentiment from cautious to optimistic.
Curved Bottom Formations and Accumulation Signals
The daily chart also shows signs of curved bottom formations developing near recent lows. This pattern often reflects gradual accumulation rather than sharp speculative buying.
Curved bottoms are typically associated with longer-term investors building positions quietly. Unlike V-shaped recoveries, they indicate patience and reduced urgency—traits consistent with institutional or strategic accumulation.
However, confirmation requires sustained higher lows and supportive volume trends. Without volume expansion, curved bottoms can fail and revert into extended sideways movement.
Volume and Market Participation
Volume analysis remains a key missing piece in XRP’s technical picture. While price has stabilized, volume has yet to show a decisive expansion that would confirm strong conviction from buyers.
Breakouts that occur on low volume are more prone to failure. For XRP to sustain a rally toward $2.23 and beyond, participation must increase across spot and derivatives markets.
Traders are therefore monitoring volume closely during any attempt to break above wedge resistance or weekly trendlines.
Macro Context: Payments, Institutions, and Ripple’s Narrative
Institutional Focus on Digital Payments
Beyond technical factors, XRP’s long-term outlook is shaped by macro narratives surrounding digital payments and financial infrastructure. Analysts such as X Finance Bull have pointed to growing institutional discussions around blockchain-based settlement systems.
At global forums, including the World Economic Forum, topics such as CBDCs, tokenized assets, and cross-border payment rails have gained prominence. These discussions align closely with Ripple’s core value proposition.
Ripple has long positioned XRP as a bridge asset designed to facilitate efficient cross-border transactions. Any meaningful adoption of blockchain-based payment infrastructure could indirectly support XRP’s long-term demand narrative.
Ripple Leadership and Market Perception
Ripple CEO Brad Garlinghouse has repeatedly emphasized institutional adoption and regulatory clarity as key growth drivers. While these themes resonate with long-term investors, short-term price action remains primarily driven by technical and liquidity factors.
Markets often price narratives gradually. Technical confirmation is usually required before sentiment-driven optimism translates into sustained price appreciation.
Risk Factors and Alternative Scenarios
Despite improving signals, XRP’s outlook is not without risks.
- A loss of the $1.96–$2.00 support zone would weaken the bullish setup
- Failure to break wedge resistance could extend consolidation
- Broader market weakness could cap upside momentum
- Low volume breakouts may fail
Traders are therefore balancing optimism with caution, waiting for confirmation rather than anticipating outcomes prematurely.
Short-Term, Medium-Term, and Long-Term Outlook
Short-Term (Days to Weeks)
In the short term, XRP is likely to remain range-bound unless a clear breakout occurs. Key levels to watch include:
- Support: $1.96–$2.00
- Resistance: Falling wedge upper boundary, then $2.23
Medium-Term (Weeks to Months)
If XRP confirms a breakout and holds above $2.23, momentum could carry price toward $2.75. Weekly MACD confirmation would strengthen this scenario.
Long-Term (Months and Beyond)
Long-term performance will depend on broader adoption narratives, regulatory clarity, and overall crypto market conditions. Technical structures suggest stabilization, but sustained trends require fundamental follow-through.
Read More: Pump.fun Expands Into Investments as Memecoin Market Cools
FAQ’s
What is the current technical outlook for XRP?
XRP is showing signs of stabilization near $2.01, with a falling wedge pattern forming on lower timeframes that may indicate a bullish reversal.
What is a falling wedge pattern and why is it important for XRP?
A falling wedge is a bullish reversal pattern formed by converging downward-sloping support and resistance lines. It suggests weakening selling pressure and potential upside if price breaks above the wedge.
What does the weekly MACD indicate for XRP?
The weekly MACD is showing a potential bullish crossover, signaling that bearish momentum is weakening and a momentum shift could be forming after a prolonged downtrend.
What are the key support levels for XRP in the short term?
The most critical support zone is between $1.96 and $2.00. Holding this level is essential for maintaining the current bullish structure.
What price level would confirm the potential breakout?
A confirmed breakout would require XRP to break above the falling wedge resistance and reclaim the $2.23 level, which is a significant short-term resistance zone.
What are the next major resistance targets if XRP breaks out?
If XRP breaks above $2.23, the next major resistance zone is around $2.75, which aligns with prior consolidation and distribution areas.
How do broader market trends affect XRP’s price outlook?
Broader trends in digital payments, institutional adoption, and blockchain-based settlement systems influence XRP’s long-term narrative, but short-term price action remains primarily driven by technical structure and liquidity.
Conclusion
XRP is approaching a critical technical juncture. A falling wedge pattern, weakening bearish momentum, and strong structural support suggest that downside pressure may be nearing exhaustion. At the same time, key resistance levels remain unbroken, keeping the broader trend neutral rather than bullish.
A confirmed breakout above wedge resistance and the $2.23 zone would significantly improve XRP’s outlook, potentially signaling the start of a renewed uptrend. Until then, traders remain focused on confirmation, volume expansion, and weekly closes.