

Key Insights
- Ethereum’s price has declined sharply in recent weeks despite strong on-chain growth.
- Active users, transactions, stablecoin volume, and real-world asset adoption are all rising.
- Technical indicators show Ethereum forming a bearish flag pattern on higher timeframes.
- If selling pressure continues, ETH could retest the $2,500 psychological support level.
Introduction: A Disconnect Between Price and Fundamentals
Ethereum, the world’s second-largest cryptocurrency by market capitalization, is once again testing investor conviction. Over the past several weeks, ETH has experienced a notable price correction, slipping below critical psychological and technical levels—even as its underlying network activity reaches new highs.
- Key Insights
- Introduction: A Disconnect Between Price and Fundamentals
- Ethereum’s Recent Price Performance in Context
- On-Chain Analysis: Ethereum’s Network Is Still Expanding
- Falling Fees Are Driving Renewed Adoption
- Stablecoin Dominance: Ethereum’s Strongest Use Case
- Real-World Asset Tokenization: Ethereum’s Institutional Advantage
- Major Institutions Are Choosing Ethereum
- Future Upgrades: Why Ethereum’s Growth Isn’t Slowing
- Why Ethereum’s Price Is Falling Despite Growth
- Broader Crypto Market Weakness
- Rising Geopolitical Tensions
- Trump’s Tariff Threats and Market Sentiment
- Spot ETH ETF Outflows
- Ethereum Technical Analysis: Bearish Flag Pattern Emerges
- Ethereum Price Prediction: Key Levels to Watch
- What This Means for Investors
- FAQ’s
- Why is Ethereum’s price falling despite strong on-chain growth?
- What is a bearish flag pattern and why does it matter for ETH?
- What is the downside price target for Ethereum?
- What level would invalidate the bearish outlook for ETH?
- How important is Ethereum’s stablecoin dominance?
- Why are institutional investors still interested in Ethereum?
- Can upcoming Ethereum upgrades impact its price?
- Conclusion
This divergence between price performance and on-chain fundamentals has raised important questions among traders, analysts, and long-term investors. How can Ethereum be growing faster than nearly every other blockchain while its token struggles? Is the price action signaling deeper structural weakness, or is this a temporary macro-driven dislocation?
As of Monday, Ethereum was trading near $2,890, having fallen below the key $3,000 support zone. The decline represents a nearly 15% drop from its 2025 highs and places ETH approximately 42% below its all-time high set in November 2021. Meanwhile, metrics such as transaction volume, active addresses, stablecoin usage, and real-world asset tokenization continue to expand at an accelerating pace.
This article examines the paradox at the heart of Ethereum’s current market cycle—strong fundamentals versus weak price action—and explores whether the bearish trend is likely to deepen or eventually reverse.
Ethereum’s Recent Price Performance in Context
Ethereum’s price weakness cannot be viewed in isolation. The broader cryptocurrency market has been under pressure, with Bitcoin, altcoins, and risk assets all experiencing heightened volatility amid geopolitical uncertainty and shifting macroeconomic expectations.
After rallying strongly earlier in the year, ETH encountered heavy resistance near the $3,400–$3,600 region. Sellers repeatedly defended this zone, leading to a breakdown below the $3,000 support area—a level that had previously acted as a psychological and structural floor.
Once that support failed, momentum traders and short-term holders accelerated the decline. The result was a cascading move lower, dragging ETH toward the high-$2,800 range despite minimal deterioration in network health.
On-Chain Analysis: Ethereum’s Network Is Still Expanding
While price charts paint a bearish picture, Ethereum’s on-chain data tells a very different story.
According to data compiled by Nansen, Ethereum has emerged as one of the fastest-growing blockchains in the crypto industry over the past month. This growth is notable given Ethereum’s already massive scale, where incremental gains are typically harder to achieve than on smaller networks.
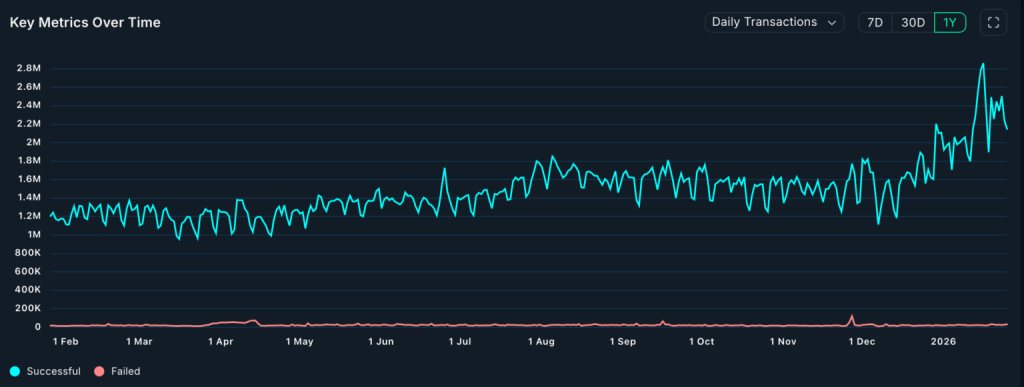
Transaction Growth Accelerates
Ethereum transactions increased by 36% over the past 30 days, surpassing 64 million transactions during that period. This surge coincides with continued ecosystem expansion following the Fusaka upgrade, which introduced improvements aimed at network efficiency and scalability.
Transaction growth of this magnitude suggests rising real usage rather than speculative activity alone. More importantly, it reinforces Ethereum’s role as the settlement layer of choice for decentralized finance, stablecoins, and tokenized assets.
Active Addresses and Daily Users Surge
Active address metrics have also strengthened considerably. Over the past month:
- Active addresses jumped 50%, reaching more than 14.3 million
- Daily active users exceeded 865,500, up sharply from the December low of roughly 412,250
These figures highlight a resurgence in user engagement, contradicting narratives that Ethereum is losing relevance to alternative layer-1 or layer-2 networks.
Falling Fees Are Driving Renewed Adoption

One of the most significant drivers of Ethereum’s on-chain resurgence has been the sustained decline in transaction fees.
For much of its history, Ethereum faced criticism for high gas costs, which pushed users toward layer-2 networks and competing blockchains. However, recent upgrades and improved network efficiency have dramatically reduced average fees, making Ethereum competitive—even cheaper in some cases—than certain layer-2 solutions.
Lower fees have had several important effects:
- Increased stablecoin transfers directly on Ethereum
- Higher frequency of retail and institutional transactions
- Renewed interest from developers deploying smart contracts on mainnet
As a result, Ethereum is reclaiming activity that had previously migrated elsewhere.
Stablecoin Dominance: Ethereum’s Strongest Use Case

Ethereum remains the undisputed leader in the stablecoin economy, a sector that underpins much of the crypto ecosystem’s liquidity and real-world utility.
Data from Artemis shows that Ethereum hosts over 7.1 million active stablecoin addresses, the highest of any blockchain network. Over the past 30 days alone, Ethereum processed approximately $986 billion in stablecoin transaction volume.
USDC and USDT Lead the Charge
The majority of stablecoin activity on Ethereum is driven by:
- USDC (Circle)
- USDT (Tether)
Other notable stablecoins on Ethereum include DAI, USDS, and emerging tokenized cash equivalents used in DeFi and institutional settlement systems.
This level of stablecoin dominance reinforces Ethereum’s role as the financial backbone of crypto markets, particularly for cross-border payments, decentralized lending, and institutional settlements.
Real-World Asset Tokenization: Ethereum’s Institutional Advantage
Beyond stablecoins, Ethereum has established itself as the leading blockchain for real-world asset (RWA) tokenization, one of the most promising sectors in crypto.
According to TokenTerminal, Ethereum hosts over $10 billion worth of tokenized real-world assets, giving it a market share exceeding 60% across the RWA ecosystem.
Dominance Across Multiple Asset Classes
Ethereum leads across several categories:
- Tokenized commodities: Over $4.5 billion
- Tokenized treasuries: Market leader by volume
- Tokenized equities and funds: Clear dominance
By comparison, BNB Chain—the second-largest competitor in RWA—holds just $26 million in tokenized commodities, highlighting the vast gap between Ethereum and rival networks.
Major Institutions Are Choosing Ethereum
Ethereum’s institutional appeal continues to grow. Large financial players entering the tokenization space overwhelmingly favor Ethereum due to its security, decentralization, regulatory familiarity, and developer ecosystem.
A prime example is JP Morgan’s recently launched My OnChain Net Yield Fund (MONY), which accumulated over $100 million in assets within its first week of operation—entirely on Ethereum infrastructure.
Such developments signal that Ethereum is increasingly becoming the default blockchain for traditional finance experiments and long-term infrastructure deployment.
Future Upgrades: Why Ethereum’s Growth Isn’t Slowing
Ethereum’s roadmap remains one of the most ambitious in the crypto industry.
Upcoming upgrades such as Glamsterdam and Hegota aim to further enhance:
- Scalability
- Privacy through zero-knowledge proofs (ZKPs)
- Network speed and data availability via sharding
These upgrades are expected to strengthen Ethereum’s competitive position and further reduce transaction costs, encouraging broader adoption across both retail and institutional users.
Why Ethereum’s Price Is Falling Despite Growth
Despite these overwhelmingly positive fundamentals, ETH’s price continues to trend lower. Several macro and market-specific factors explain this disconnect.
Broader Crypto Market Weakness
Ethereum’s decline mirrors weakness across the broader crypto market. Bitcoin has struggled to sustain momentum, and most altcoins have followed suit. When market-wide risk appetite deteriorates, even fundamentally strong assets tend to sell off.
Rising Geopolitical Tensions
Global geopolitical instability has increased risk aversion across financial markets. Developments such as:
- Heightened military tensions in the Middle East
- U.S. naval deployments
- Trade threats involving major economies
have pushed investors toward defensive assets, reducing speculative exposure.
Trump’s Tariff Threats and Market Sentiment
Donald Trump’s renewed tariff threats—particularly toward Canada—have injected additional uncertainty into global markets. While crypto is not directly tied to trade flows, macro instability often leads to liquidity contraction, which disproportionately affects risk assets.
Spot ETH ETF Outflows
Another key factor weighing on Ethereum is persistent outflows from spot ETH ETFs. Over the past week, these funds recorded millions of dollars in net redemptions as some investors rotated capital into traditional safe havens such as gold and silver.
ETF outflows create consistent sell pressure, dampening price recovery attempts even when on-chain demand is strong.
Ethereum Technical Analysis: Bearish Flag Pattern Emerges
From a technical perspective, Ethereum’s chart structure supports a cautious outlook.
Breakdown Below Key Moving Averages
On the three-day chart, ETH has fallen below both:
- Short-term exponential moving averages (EMAs)
- Long-term EMAs
This alignment typically signals a bearish market phase, where rallies are more likely to be sold than extended.
Bearish Flag Formation Explained
Ethereum has formed a bearish flag pattern, a continuation structure that often appears after a sharp decline.
The pattern consists of:
- A strong downward move (the flagpole)
- A period of consolidation or sideways movement (the flag)
ETH is currently hovering near the lower boundary of the flag, increasing the probability of a downside breakdown.
Ethereum Price Prediction: Key Levels to Watch
If the bearish flag confirms, Ethereum could experience another leg lower.
Downside Target: $2,500
The most likely downside target sits near $2,500, a major psychological level that also aligns with historical demand zones. A breakdown toward this level would represent a controlled continuation of the existing trend rather than a capitulation event.
Invalidation Level: $3,425
The bearish outlook would be invalidated if ETH breaks above the upper boundary of the flag, currently around $3,425. Such a move would likely signal renewed bullish momentum and a potential trend reversal.
What This Means for Investors
Ethereum’s current phase highlights an important reality of financial markets: price and fundamentals do not always move in sync.
For long-term investors, the ongoing growth in network activity, institutional adoption, and real-world usage strengthens Ethereum’s investment thesis. For short-term traders, however, technical trends and macro conditions remain the dominant drivers.
Until broader market sentiment improves or ETH reclaims key resistance levels, downside risks cannot be ignored.
Read More: Trump Warns of 100% Tariffs After Canada Rejects China Trade Deal
FAQ’s
Why is Ethereum’s price falling despite strong on-chain growth?
Ethereum’s price is declining due to broader crypto market weakness, geopolitical uncertainty, ETF outflows, and risk-off investor sentiment, despite rising network activity.
What is a bearish flag pattern and why does it matter for ETH?
A bearish flag is a continuation pattern that forms after a sharp drop, signaling a potential further decline if price breaks below the consolidation range.
What is the downside price target for Ethereum?
Based on current technical patterns, Ethereum could fall toward the $2,500 level if selling pressure continues and support fails.
What level would invalidate the bearish outlook for ETH?
The bearish scenario would be invalidated if Ethereum breaks above the $3,425 resistance level, indicating a potential trend reversal.
How important is Ethereum’s stablecoin dominance?
Ethereum’s leadership in stablecoins is critical, as it underpins liquidity, DeFi activity, and institutional adoption across the crypto ecosystem.
Why are institutional investors still interested in Ethereum?
Institutions favor Ethereum due to its security, regulatory familiarity, strong developer ecosystem, and leadership in real-world asset tokenization.
Can upcoming Ethereum upgrades impact its price?
Yes. Future upgrades like Glamsterdam and Hegota could improve scalability, privacy, and transaction efficiency, potentially supporting long-term price growth.
Conclusion
Ethereum is at a crossroads. On-chain metrics, stablecoin dominance, and institutional adoption paint a picture of a blockchain growing stronger by the day. Yet price action reflects caution, uncertainty, and macro-driven risk aversion.
If global markets stabilize and regulatory clarity improves, Ethereum’s fundamentals could once again take center stage. Until then, traders should remain vigilant, watching critical technical levels while recognizing that Ethereum’s long-term trajectory remains firmly intact.